|
Download Data (XLS File) |
|
||||||||
|
||||||||
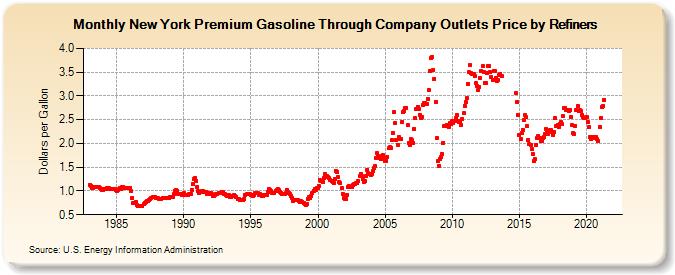
| New York Premium Gasoline Through Company Outlets Price by Refiners (Dollars per Gallon) | ||||||||
| Year | Jan | Feb | Mar | Apr | May | Jun | Jul | Aug | Sep | Oct | Nov | Dec |
|---|---|---|---|---|---|---|---|---|---|---|---|---|
| 1983 | 1.134 | 1.101 | 1.059 | 1.062 | 1.083 | 1.092 | 1.084 | 1.078 | 1.075 | 1.057 | 1.047 | 1.029 |
| 1984 | 1.030 | 1.045 | 1.038 | 1.053 | 1.051 | 1.053 | 1.049 | 1.034 | 1.040 | 1.033 | 1.032 | 1.027 |
| 1985 | 1.003 | 1.021 | 1.036 | 1.052 | 1.047 | 1.075 | 1.084 | 1.071 | 1.071 | 1.068 | 1.065 | 1.062 |
| 1986 | 1.063 | 0.994 | 0.853 | 0.740 | 0.751 | 0.775 | 0.710 | 0.673 | 0.689 | 0.677 | 0.676 | 0.682 |
| 1987 | 0.720 | 0.749 | 0.765 | 0.787 | 0.788 | 0.815 | 0.835 | 0.860 | 0.872 | 0.866 | 0.872 | 0.851 |
| 1988 | 0.856 | 0.842 | 0.824 | 0.822 | 0.832 | 0.849 | 0.852 | 0.860 | 0.862 | 0.857 | 0.860 | 0.856 |
| 1989 | 0.865 | 0.876 | 0.874 | 0.927 | 1.009 | 1.029 | 1.003 | 0.942 | 0.936 | 0.933 | 0.921 | 0.936 |
| 1990 | 0.950 | 0.922 | 0.908 | 0.908 | 0.918 | 0.935 | 0.933 | 1.026 | 1.152 | 1.254 | 1.276 | 1.206 |
| 1991 | 1.085 | 0.993 | 0.959 | 0.975 | 1.000 | 0.995 | 0.976 | 0.973 | 0.972 | 0.946 | 0.963 | 0.934 |
| 1992 | 0.949 | 0.927 | 0.897 | 0.895 | 0.918 | 0.934 | 0.944 | 0.957 | 0.954 | 0.962 | 0.983 | 0.972 |
| 1993 | 0.946 | 0.926 | 0.909 | 0.903 | 0.907 | 0.874 | 0.867 | 0.904 | 0.899 | 0.919 | 0.893 | 0.863 |
| 1994 | 0.835 | 0.830 | 0.818 | 0.820 | 0.818 | 0.809 | 0.840 | 0.925 | 0.929 | 0.941 | 0.936 | 0.934 |
| 1995 | 0.913 | 0.908 | 0.901 | 0.913 | 0.959 | 0.959 | 0.950 | 0.910 | 0.931 | 0.918 | 0.890 | 0.896 |
| 1996 | 0.906 | 0.911 | 0.922 | 0.986 | 1.038 | 1.028 | 0.996 | 0.951 | 0.950 | 0.963 | 1.006 | 1.030 |
| 1997 | 1.033 | 1.013 | 0.986 | 0.963 | 0.942 | 0.926 | 0.940 | 0.950 | 1.023 | 0.981 | 0.965 | 0.935 |
| 1998 | 0.894 | 0.848 | 0.799 | 0.803 | 0.806 | 0.810 | 0.802 | 0.787 | 0.773 | 0.780 | 0.774 | 0.746 |
| 1999 | 0.732 | 0.700 | 0.727 | 0.841 | 0.873 | 0.858 | 0.887 | 0.953 | 1.006 | 1.035 | 1.027 | 1.055 |
| 2000 | 1.067 | 1.098 | 1.228 | 1.216 | 1.191 | 1.272 | 1.358 | 1.311 | 1.309 | 1.285 | 1.267 | 1.238 |
| 2001 | 1.200 | 1.192 | 1.163 | 1.253 | 1.428 | 1.407 | 1.290 | 1.190 | 1.163 | 1.052 | 0.944 | 0.844 |
| 2002 | 0.836 | 0.835 | 0.919 | 1.080 | 1.099 | 1.089 | 1.093 | 1.134 | 1.139 | 1.153 | 1.168 | 1.170 |
| 2003 | 1.206 | 1.308 | 1.359 | 1.323 | 1.253 | 1.190 | 1.209 | 1.306 | 1.450 | 1.382 | 1.348 | 1.331 |
| 2004 | 1.367 | 1.425 | 1.487 | 1.517 | 1.700 | 1.792 | 1.740 | 1.695 | 1.664 | 1.743 | 1.753 | 1.699 |
| 2005 | 1.629 | 1.640 | 1.719 | 1.894 | 1.922 | 1.912 | 2.066 | 2.217 | 2.661 | 2.434 | 2.074 | 1.971 |
| 2006 | 2.134 | 2.091 | 2.096 | 2.452 | 2.666 | 2.676 | 2.755 | 2.748 | 2.379 | 2.010 | 1.976 | 2.098 |
| 2007 | 2.066 | 2.013 | 2.310 | 2.529 | 2.727 | 2.773 | 2.735 | 2.607 | 2.527 | 2.557 | 2.810 | 2.859 |
| 2008 | 2.855 | 2.827 | 2.937 | 3.116 | 3.521 | 3.790 | 3.826 | 3.545 | 3.359 | 2.882 | 2.112 | 1.630 |
| 2009 | 1.533 | 1.680 | 1.704 | 1.782 | 2.017 | 2.362 | 2.357 | 2.394 | 2.386 | 2.337 | 2.427 | 2.408 |
| 2010 | 2.472 | 2.428 | 2.466 | 2.538 | 2.601 | 2.481 | 2.458 | 2.451 | 2.387 | 2.511 | 2.635 | 2.798 |
| 2011 | 2.877 | 2.946 | 3.251 | 3.494 | 3.649 | 3.474 | 3.457 | 3.452 | 3.410 | 3.262 | 3.210 | 3.118 |
| 2012 | 3.184 | 3.369 | 3.522 | 3.623 | 3.499 | 3.272 | 3.276 | 3.474 | 3.639 | 3.621 | 3.504 | 3.389 |
| 2013 | 3.333 | 3.523 | 3.528 | 3.384 | 3.324 | 3.340 | 3.432 | 3.462 | 3.409 | NA | NA | W |
| 2014 | W | W | W | W | W | W | W | W | W | 3.058 | 2.872 | 2.596 |
| 2015 | 2.169 | 2.084 | 2.221 | 2.283 | 2.498 | 2.592 | 2.551 | 2.365 | 2.073 | 1.978 | 1.957 | 1.887 |
| 2016 | 1.768 | 1.621 | 1.666 | 1.971 | 2.119 | 2.163 | 2.111 | 2.047 | 2.050 | 2.110 | 2.142 | 2.205 |
| 2017 | 2.304 | 2.250 | 2.203 | 2.273 | 2.279 | 2.233 | 2.185 | 2.240 | 2.525 | 2.367 | 2.398 | 2.339 |
| 2018 | 2.411 | 2.455 | 2.412 | 2.568 | 2.755 | 2.742 | 2.704 | 2.697 | 2.690 | 2.701 | 2.565 | 2.385 |
| 2019 | 2.230 | 2.203 | 2.373 | 2.697 | 2.789 | 2.676 | 2.700 | 2.678 | 2.598 | 2.549 | 2.535 | 2.530 |
| 2020 | 2.557 | 2.449 | 2.342 | 2.135 | 2.090 | 2.124 | 2.131 | 2.120 | 2.134 | 2.086 | 2.054 | NA |
| 2021 | 2.338 | 2.541 | 2.772 | 2.788 | 2.921 | W | W | W | W | W | W | W |
| 2022 | W | W | W | |||||||||
| - = No Data Reported; -- = Not Applicable; NA = Not Available; W = Withheld to avoid disclosure of individual company data. |
| Release Date: 6/1/2022 |
| Next Release Date: TBD |