|
Download Data (XLS File) |
|
||||||||
|
||||||||
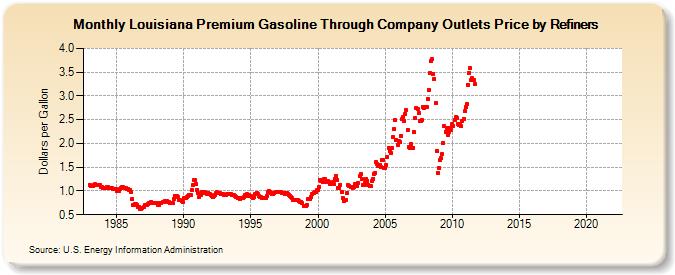
| Louisiana Premium Gasoline Through Company Outlets Price by Refiners (Dollars per Gallon) | ||||||||
| Year | Jan | Feb | Mar | Apr | May | Jun | Jul | Aug | Sep | Oct | Nov | Dec |
|---|---|---|---|---|---|---|---|---|---|---|---|---|
| 1983 | 1.133 | 1.100 | 1.108 | 1.102 | 1.119 | 1.141 | 1.133 | 1.117 | 1.120 | 1.115 | 1.084 | 1.087 |
| 1984 | 1.056 | 1.057 | 1.056 | 1.077 | 1.077 | 1.068 | 1.067 | 1.058 | 1.055 | 1.051 | 1.044 | 1.039 |
| 1985 | 1.007 | 0.993 | 1.008 | 1.042 | 1.067 | 1.079 | 1.075 | 1.068 | 1.054 | 1.035 | 1.034 | 1.030 |
| 1986 | 1.026 | 0.977 | 0.822 | 0.701 | 0.718 | 0.729 | 0.703 | 0.658 | 0.667 | 0.628 | 0.630 | 0.643 |
| 1987 | 0.669 | 0.707 | 0.705 | 0.713 | 0.716 | 0.744 | 0.751 | 0.778 | 0.757 | 0.751 | 0.754 | 0.745 |
| 1988 | 0.737 | 0.710 | 0.713 | 0.738 | 0.757 | 0.758 | 0.774 | 0.797 | 0.789 | 0.783 | 0.778 | 0.760 |
| 1989 | 0.755 | 0.749 | 0.754 | 0.831 | 0.897 | 0.900 | 0.888 | 0.865 | 0.811 | 0.804 | 0.783 | 0.776 |
| 1990 | 0.848 | 0.851 | 0.852 | 0.863 | 0.885 | 0.923 | 0.919 | 1.015 | 1.125 | 1.226 | 1.227 | 1.143 |
| 1991 | 1.028 | 0.954 | 0.882 | 0.911 | 0.977 | 0.981 | 0.958 | 0.971 | 0.958 | 0.943 | 0.961 | 0.942 |
| 1992 | 0.912 | 0.886 | 0.875 | 0.890 | 0.923 | 0.957 | 0.969 | 0.955 | 0.949 | 0.940 | 0.942 | 0.932 |
| 1993 | 0.923 | 0.907 | 0.915 | 0.928 | 0.930 | 0.933 | 0.926 | 0.921 | 0.912 | 0.910 | 0.899 | 0.869 |
| 1994 | 0.847 | 0.842 | 0.830 | 0.849 | 0.852 | 0.857 | 0.874 | 0.919 | 0.928 | 0.901 | 0.905 | 0.892 |
| 1995 | 0.885 | 0.869 | 0.857 | 0.880 | 0.945 | 0.967 | 0.942 | 0.903 | 0.879 | 0.864 | 0.846 | 0.842 |
| 1996 | 0.858 | 0.857 | 0.896 | 0.978 | 1.003 | 0.985 | 0.959 | 0.936 | 0.935 | 0.947 | 0.975 | 0.988 |
| 1997 | 0.988 | 0.983 | 0.976 | 0.972 | 0.962 | 0.956 | 0.926 | 0.960 | 0.961 | 0.946 | 0.922 | 0.902 |
| 1998 | 0.878 | 0.842 | 0.811 | 0.806 | 0.807 | 0.806 | 0.803 | 0.780 | 0.769 | 0.768 | 0.745 | 0.693 |
| 1999 | 0.688 | 0.684 | 0.710 | 0.828 | 0.838 | 0.836 | 0.870 | 0.927 | 0.959 | 0.986 | 0.985 | 1.011 |
| 2000 | 1.015 | 1.084 | 1.237 | 1.215 | 1.195 | 1.254 | 1.253 | 1.181 | 1.217 | 1.205 | 1.187 | 1.141 |
| 2001 | 1.166 | 1.183 | 1.143 | 1.249 | 1.314 | 1.237 | 1.067 | 1.059 | 1.127 | 0.985 | 0.859 | 0.783 |
| 2002 | 0.814 | 0.815 | 0.955 | 1.122 | 1.113 | 1.082 | 1.078 | 1.069 | 1.073 | 1.136 | 1.131 | 1.101 |
| 2003 | 1.171 | 1.308 | 1.347 | 1.248 | 1.130 | 1.135 | 1.177 | 1.255 | 1.219 | 1.135 | 1.107 | 1.097 |
| 2004 | 1.216 | 1.261 | 1.358 | 1.387 | 1.609 | 1.561 | 1.515 | 1.540 | 1.507 | 1.654 | 1.647 | 1.478 |
| 2005 | 1.483 | 1.548 | 1.724 | 1.905 | 1.836 | 1.802 | 1.914 | 2.139 | 2.301 | 2.487 | 2.074 | 1.965 |
| 2006 | 2.053 | 2.026 | 2.166 | 2.505 | 2.564 | 2.471 | 2.625 | 2.694 | 2.291 | 1.926 | 1.910 | 1.984 |
| 2007 | 1.905 | 1.913 | 2.237 | 2.531 | 2.746 | 2.728 | 2.648 | 2.478 | 2.476 | 2.496 | 2.768 | 2.736 |
| 2008 | 2.766 | 2.759 | 2.938 | 3.132 | 3.479 | 3.733 | 3.770 | 3.470 | 3.364 | 2.849 | 1.845 | 1.384 |
| 2009 | 1.487 | 1.646 | 1.686 | 1.773 | 2.006 | 2.361 | 2.251 | 2.329 | 2.187 | 2.238 | 2.326 | 2.292 |
| 2010 | 2.410 | 2.362 | 2.496 | 2.556 | 2.539 | 2.417 | 2.380 | 2.401 | 2.367 | 2.477 | 2.511 | 2.674 |
| 2011 | 2.760 | 2.836 | 3.240 | 3.486 | 3.581 | 3.344 | 3.370 | 3.329 | 3.246 | W | W | W |
| 2012 | W | W | W | W | W | W | W | W | W | W | W | W |
| 2013 | W | W | W | W | - | - | - | - | - | - | - | - |
| 2014 | - | - | - | - | - | - | - | - | - | - | - | - |
| 2015 | - | - | - | - | - | - | - | - | - | - | - | - |
| 2016 | - | - | - | - | - | - | - | - | - | - | - | - |
| 2017 | - | - | - | - | - | - | - | - | - | - | - | - |
| 2018 | - | - | - | - | - | - | - | - | - | - | - | - |
| 2019 | - | - | - | - | - | - | - | - | - | - | - | - |
| 2020 | - | - | - | - | - | - | - | - | - | - | - | - |
| 2021 | - | - | - | - | - | - | - | - | - | - | - | - |
| 2022 | - | - | - | |||||||||
| - = No Data Reported; -- = Not Applicable; NA = Not Available; W = Withheld to avoid disclosure of individual company data. |
| Release Date: 6/1/2022 |
| Next Release Date: TBD |