|
Download Data (XLS File) |
|
||||||||
|
||||||||
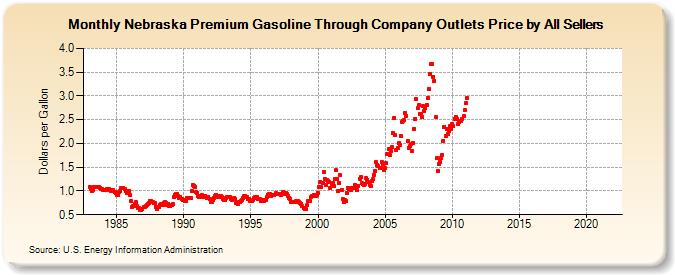
| Nebraska Premium Gasoline Through Company Outlets Price by All Sellers (Dollars per Gallon) | ||||||||
| Year | Jan | Feb | Mar | Apr | May | Jun | Jul | Aug | Sep | Oct | Nov | Dec |
|---|---|---|---|---|---|---|---|---|---|---|---|---|
| 1983 | 1.078 | 1.034 | 1.007 | 1.024 | 1.076 | 1.085 | 1.086 | 1.087 | 1.091 | 1.069 | 1.048 | 1.044 |
| 1984 | 1.023 | 1.010 | 1.017 | 1.036 | 1.044 | 1.038 | 1.017 | 0.998 | 0.990 | 1.017 | 0.987 | 0.952 |
| 1985 | 0.917 | 0.919 | 0.975 | 0.999 | 1.055 | 1.062 | 1.062 | 1.040 | 0.992 | 0.959 | 0.978 | 1.005 |
| 1986 | 0.919 | 0.787 | 0.652 | 0.677 | 0.729 | 0.760 | 0.678 | 0.645 | 0.638 | 0.592 | 0.598 | 0.619 |
| 1987 | 0.666 | 0.659 | 0.674 | 0.698 | 0.724 | 0.754 | 0.790 | 0.789 | 0.765 | 0.741 | 0.746 | 0.670 |
| 1988 | 0.620 | 0.656 | 0.655 | 0.710 | 0.722 | 0.706 | 0.751 | 0.772 | 0.743 | 0.713 | 0.732 | 0.693 |
| 1989 | 0.679 | 0.695 | 0.730 | 0.871 | 0.918 | 0.930 | 0.931 | 0.888 | 0.861 | 0.868 | 0.831 | 0.811 |
| 1990 | 0.818 | 0.799 | 0.791 | 0.848 | 0.844 | 0.862 | 0.848 | 1.003 | 1.120 | 1.107 | 1.077 | 0.974 |
| 1991 | 0.966 | 0.895 | 0.865 | 0.902 | 0.914 | 0.880 | 0.871 | 0.902 | 0.866 | 0.857 | 0.875 | 0.825 |
| 1992 | 0.760 | 0.773 | 0.813 | 0.859 | 0.893 | 0.925 | 0.882 | 0.877 | 0.895 | 0.888 | 0.865 | 0.833 |
| 1993 | 0.811 | 0.807 | 0.852 | 0.871 | 0.874 | 0.869 | 0.832 | 0.819 | 0.822 | 0.857 | 0.826 | 0.747 |
| 1994 | 0.727 | 0.774 | 0.774 | 0.795 | 0.813 | 0.844 | 0.884 | 0.895 | 0.869 | 0.829 | 0.829 | 0.796 |
| 1995 | 0.792 | 0.793 | 0.806 | 0.846 | 0.881 | 0.863 | 0.825 | 0.829 | 0.821 | 0.795 | 0.795 | 0.806 |
| 1996 | 0.798 | 0.817 | 0.865 | 0.923 | 0.930 | 0.936 | 0.904 | 0.906 | 0.920 | 0.920 | 0.957 | 0.944 |
| 1997 | 0.944 | 0.928 | 0.941 | 0.918 | 0.944 | 0.973 | 0.935 | 0.966 | 0.938 | 0.890 | 0.862 | 0.836 |
| 1998 | 0.766 | 0.759 | 0.769 | 0.770 | 0.783 | 0.778 | 0.781 | 0.761 | 0.746 | 0.731 | 0.682 | 0.631 |
| 1999 | 0.621 | 0.615 | 0.698 | 0.784 | 0.787 | 0.782 | 0.870 | 0.892 | 0.924 | 0.904 | 0.895 | 0.917 |
| 2000 | 0.963 | 1.084 | 1.191 | 1.075 | 1.169 | 1.400 | 1.256 | 1.125 | 1.239 | 1.217 | 1.180 | 1.067 |
| 2001 | 1.140 | 1.167 | 1.095 | 1.256 | 1.435 | 1.262 | 1.006 | 1.157 | 1.330 | 1.025 | 0.830 | 0.769 |
| 2002 | 0.801 | 0.791 | 0.954 | 1.063 | 1.043 | 1.025 | 1.068 | 1.064 | 1.061 | 1.128 | 1.073 | 1.011 |
| 2003 | 1.109 | 1.259 | 1.290 | 1.160 | 1.139 | 1.131 | 1.150 | 1.263 | 1.235 | 1.181 | 1.127 | 1.104 |
| 2004 | 1.202 | 1.253 | 1.345 | 1.415 | 1.600 | 1.553 | 1.517 | 1.491 | 1.485 | 1.599 | 1.569 | 1.436 |
| 2005 | 1.482 | 1.582 | 1.776 | 1.891 | 1.758 | 1.831 | 1.927 | 2.227 | 2.541 | 2.179 | 1.858 | 1.914 |
| 2006 | 2.004 | 1.960 | 2.159 | 2.447 | 2.478 | 2.499 | 2.640 | 2.585 | 2.056 | 1.905 | 1.937 | 1.996 |
| 2007 | 1.831 | 2.011 | 2.303 | 2.520 | 2.927 | 2.742 | 2.804 | 2.626 | 2.618 | 2.555 | 2.786 | 2.693 |
| 2008 | 2.740 | 2.805 | 2.963 | 3.140 | 3.467 | 3.670 | 3.667 | 3.407 | 3.309 | 2.550 | 1.687 | 1.419 |
| 2009 | 1.565 | 1.610 | 1.692 | 1.757 | 2.060 | 2.355 | 2.152 | 2.305 | 2.201 | 2.263 | 2.369 | 2.308 |
| 2010 | 2.411 | 2.364 | 2.524 | 2.561 | 2.507 | 2.405 | 2.451 | 2.474 | 2.475 | 2.521 | 2.575 | 2.697 |
| 2011 | 2.849 | 2.958 | - | - | - | - | - | - | - | - | - | - |
| 2012 | - | - | - | - | - | - | - | - | - | - | - | - |
| 2013 | - | - | - | - | - | - | - | - | - | - | - | - |
| 2014 | - | - | - | - | - | - | - | - | - | - | - | - |
| 2015 | - | - | - | - | - | - | - | - | - | - | - | - |
| 2016 | - | - | - | - | - | - | - | - | - | - | - | - |
| 2017 | - | - | - | - | - | - | - | - | - | - | - | - |
| 2018 | - | - | - | - | - | - | - | - | - | - | - | - |
| 2019 | - | - | - | - | - | - | - | - | - | - | - | - |
| 2020 | - | - | - | - | - | - | - | - | - | - | - | - |
| 2021 | - | - | - | - | - | - | - | - | - | - | - | - |
| 2022 | - | - | - | |||||||||
| - = No Data Reported; -- = Not Applicable; NA = Not Available; W = Withheld to avoid disclosure of individual company data. |
| Release Date: 6/1/2022 |
| Next Release Date: TBD |