|
Download Data (XLS File) |
|
||||||||
|
||||||||
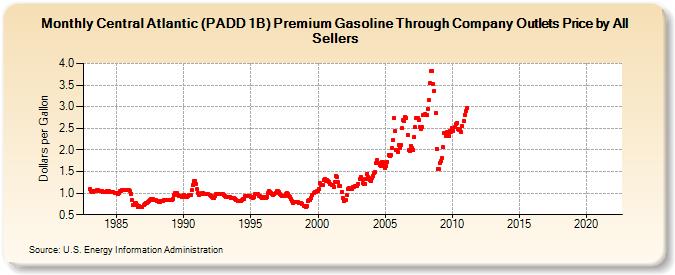
| Central Atlantic (PADD 1B) Premium Gasoline Through Company Outlets Price by All Sellers (Dollars per Gallon) | ||||||||
| Year | Jan | Feb | Mar | Apr | May | Jun | Jul | Aug | Sep | Oct | Nov | Dec |
|---|---|---|---|---|---|---|---|---|---|---|---|---|
| 1983 | 1.094 | 1.049 | 1.029 | 1.026 | 1.043 | 1.055 | 1.066 | 1.067 | 1.056 | 1.040 | 1.049 | 1.053 |
| 1984 | 1.024 | 1.033 | 1.031 | 1.042 | 1.043 | 1.045 | 1.036 | 1.024 | 1.021 | 1.017 | 1.013 | 1.007 |
| 1985 | 0.992 | 0.986 | 1.005 | 1.039 | 1.055 | 1.068 | 1.076 | 1.070 | 1.064 | 1.063 | 1.062 | 1.064 |
| 1986 | 1.048 | 0.988 | 0.839 | 0.728 | 0.766 | 0.782 | 0.720 | 0.687 | 0.693 | 0.676 | 0.685 | 0.689 |
| 1987 | 0.722 | 0.755 | 0.766 | 0.781 | 0.795 | 0.819 | 0.839 | 0.859 | 0.856 | 0.846 | 0.850 | 0.834 |
| 1988 | 0.823 | 0.808 | 0.793 | 0.802 | 0.819 | 0.824 | 0.837 | 0.847 | 0.840 | 0.837 | 0.840 | 0.842 |
| 1989 | 0.850 | 0.852 | 0.865 | 0.946 | 1.001 | 1.007 | 0.994 | 0.955 | 0.932 | 0.923 | 0.915 | 0.923 |
| 1990 | 0.948 | 0.927 | 0.914 | 0.919 | 0.930 | 0.958 | 0.962 | 1.066 | 1.183 | 1.276 | 1.285 | 1.212 |
| 1991 | 1.085 | 0.994 | 0.958 | 0.974 | 1.002 | 0.997 | 0.978 | 0.986 | 0.988 | 0.968 | 0.979 | 0.956 |
| 1992 | 0.937 | 0.910 | 0.892 | 0.894 | 0.932 | 0.968 | 0.977 | 0.976 | 0.970 | 0.977 | 0.987 | 0.971 |
| 1993 | 0.948 | 0.924 | 0.903 | 0.901 | 0.909 | 0.904 | 0.896 | 0.896 | 0.883 | 0.892 | 0.874 | 0.844 |
| 1994 | 0.826 | 0.825 | 0.818 | 0.820 | 0.833 | 0.853 | 0.875 | 0.932 | 0.935 | 0.932 | 0.943 | 0.934 |
| 1995 | 0.914 | 0.906 | 0.894 | 0.911 | 0.970 | 0.984 | 0.969 | 0.941 | 0.930 | 0.905 | 0.879 | 0.888 |
| 1996 | 0.902 | 0.895 | 0.918 | 0.998 | 1.045 | 1.028 | 0.999 | 0.971 | 0.964 | 0.974 | 1.013 | 1.039 |
| 1997 | 1.040 | 1.022 | 0.976 | 0.950 | 0.943 | 0.939 | 0.938 | 0.984 | 1.010 | 0.975 | 0.941 | 0.904 |
| 1998 | 0.867 | 0.817 | 0.778 | 0.785 | 0.798 | 0.801 | 0.790 | 0.775 | 0.763 | 0.769 | 0.755 | 0.712 |
| 1999 | 0.699 | 0.676 | 0.710 | 0.820 | 0.844 | 0.836 | 0.882 | 0.951 | 0.994 | 1.016 | 1.021 | 1.042 |
| 2000 | 1.049 | 1.092 | 1.226 | 1.191 | 1.199 | 1.294 | 1.335 | 1.284 | 1.296 | 1.281 | 1.266 | 1.218 |
| 2001 | 1.193 | 1.189 | 1.152 | 1.252 | 1.407 | 1.377 | 1.247 | 1.169 | 1.155 | 1.029 | 0.897 | 0.825 |
| 2002 | 0.844 | 0.847 | 0.952 | 1.103 | 1.108 | 1.094 | 1.102 | 1.132 | 1.139 | 1.158 | 1.169 | 1.170 |
| 2003 | 1.218 | 1.330 | 1.374 | 1.315 | 1.237 | 1.203 | 1.221 | 1.329 | 1.443 | 1.369 | 1.309 | 1.279 |
| 2004 | 1.343 | 1.402 | 1.460 | 1.494 | 1.695 | 1.757 | 1.695 | 1.651 | 1.629 | 1.726 | 1.716 | 1.617 |
| 2005 | 1.582 | 1.622 | 1.727 | 1.893 | 1.864 | 1.881 | 2.043 | 2.237 | 2.736 | 2.432 | 2.007 | 1.952 |
| 2006 | 2.118 | 2.054 | 2.106 | 2.498 | 2.685 | 2.669 | 2.772 | 2.741 | 2.348 | 1.993 | 1.968 | 2.091 |
| 2007 | 2.035 | 1.995 | 2.301 | 2.524 | 2.736 | 2.744 | 2.683 | 2.531 | 2.487 | 2.524 | 2.800 | 2.809 |
| 2008 | 2.832 | 2.799 | 2.957 | 3.144 | 3.542 | 3.817 | 3.822 | 3.525 | 3.369 | 2.858 | 2.021 | 1.565 |
| 2009 | 1.551 | 1.701 | 1.732 | 1.812 | 2.056 | 2.381 | 2.331 | 2.407 | 2.357 | 2.318 | 2.443 | 2.416 |
| 2010 | 2.499 | 2.447 | 2.520 | 2.590 | 2.617 | 2.485 | 2.467 | 2.465 | 2.406 | 2.552 | 2.673 | 2.818 |
| 2011 | 2.905 | 2.965 | - | - | - | - | - | - | - | - | - | - |
| 2012 | - | - | - | - | - | - | - | - | - | - | - | - |
| 2013 | - | - | - | - | - | - | - | - | - | - | - | - |
| 2014 | - | - | - | - | - | - | - | - | - | - | - | - |
| 2015 | - | - | - | - | - | - | - | - | - | - | - | - |
| 2016 | - | - | - | - | - | - | - | - | - | - | - | - |
| 2017 | - | - | - | - | - | - | - | - | - | - | - | - |
| 2018 | - | - | - | - | - | - | - | - | - | - | - | - |
| 2019 | - | - | - | - | - | - | - | - | - | - | - | - |
| 2020 | - | - | - | - | - | - | - | - | - | - | - | - |
| 2021 | - | - | - | - | - | - | - | - | - | - | - | - |
| 2022 | - | - | - | |||||||||
| - = No Data Reported; -- = Not Applicable; NA = Not Available; W = Withheld to avoid disclosure of individual company data. |
| Release Date: 6/1/2022 |
| Next Release Date: TBD |