|
Download Data (XLS File) |
|
||||||||
|
||||||||
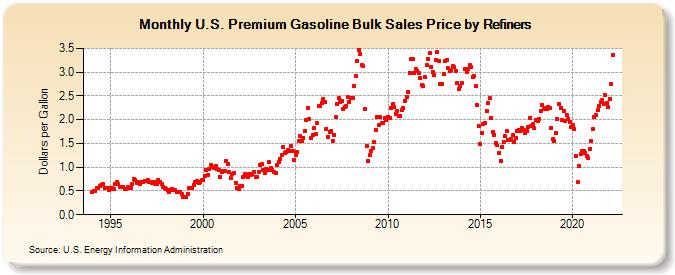
| U.S. Premium Gasoline Bulk Sales Price by Refiners (Dollars per Gallon) | ||||||||
| Year | Jan | Feb | Mar | Apr | May | Jun | Jul | Aug | Sep | Oct | Nov | Dec |
|---|---|---|---|---|---|---|---|---|---|---|---|---|
| 1994 | 0.474 | 0.499 | 0.507 | 0.555 | 0.569 | 0.598 | 0.628 | 0.642 | 0.559 | 0.555 | 0.571 | 0.522 |
| 1995 | 0.549 | 0.552 | 0.551 | 0.636 | 0.686 | 0.638 | 0.579 | 0.587 | 0.584 | 0.544 | 0.543 | 0.576 |
| 1996 | 0.572 | 0.572 | 0.639 | 0.749 | 0.740 | 0.669 | 0.680 | 0.652 | 0.681 | 0.687 | 0.711 | 0.708 |
| 1997 | 0.720 | 0.696 | 0.685 | 0.665 | 0.679 | 0.649 | 0.636 | 0.739 | 0.690 | 0.641 | 0.590 | 0.568 |
| 1998 | 0.545 | 0.510 | 0.488 | 0.529 | 0.551 | 0.524 | 0.514 | 0.484 | 0.473 | 0.487 | 0.436 | 0.367 |
| 1999 | 0.381 | 0.377 | 0.444 | 0.559 | 0.557 | 0.553 | 0.635 | 0.684 | 0.710 | 0.674 | 0.697 | 0.721 |
| 2000 | 0.736 | 0.825 | 0.940 | 0.834 | 0.957 | 1.048 | 1.011 | 0.992 | 1.028 | 0.956 | 0.932 | 0.794 |
| 2001 | 0.906 | 0.921 | 0.914 | 1.131 | 1.063 | 0.901 | 0.764 | 0.861 | 0.880 | 0.666 | 0.561 | 0.550 |
| 2002 | 0.598 | 0.604 | 0.785 | 0.854 | 0.817 | 0.798 | 0.850 | 0.834 | 0.853 | 0.893 | 0.800 | 0.801 |
| 2003 | 0.904 | 1.040 | 1.071 | 0.951 | 0.877 | 0.952 | 0.944 | 1.099 | 0.991 | 0.946 | 0.901 | 0.880 |
| 2004 | 1.037 | 1.107 | 1.162 | 1.248 | 1.430 | 1.304 | 1.318 | 1.357 | 1.349 | 1.442 | 1.336 | 1.144 |
| 2005 | 1.262 | 1.316 | 1.546 | 1.649 | 1.554 | 1.610 | 1.767 | 1.989 | 2.254 | 2.006 | 1.615 | 1.672 |
| 2006 | 1.822 | 1.688 | 1.935 | 2.286 | 2.293 | 2.360 | 2.441 | 2.378 | 1.804 | 1.644 | 1.749 | 1.755 |
| 2007 | 1.553 | 1.675 | 2.050 | 2.329 | 2.456 | 2.376 | 2.391 | 2.233 | 2.259 | 2.289 | 2.468 | 2.378 |
| 2008 | 2.455 | 2.453 | 2.712 | 2.925 | 3.244 | 3.461 | 3.377 | 3.150 | 3.119 | 2.227 | 1.437 | 1.127 |
| 2009 | 1.267 | 1.335 | 1.402 | 1.525 | 1.793 | 2.059 | 1.885 | 2.050 | 1.939 | 1.928 | 2.041 | 1.990 |
| 2010 | 2.066 | 2.028 | 2.248 | 2.320 | 2.258 | 2.118 | 2.173 | 2.067 | 2.080 | 2.201 | 2.238 | 2.399 |
| 2011 | 2.480 | 2.588 | 2.990 | 3.276 | 3.268 | 2.986 | 3.074 | 3.031 | 2.975 | 2.876 | 2.727 | 2.718 |
| 2012 | 2.888 | 3.147 | 3.286 | 3.413 | 3.111 | 3.000 | 2.947 | 3.255 | 3.428 | 3.242 | 2.747 | 2.741 |
| 2013 | 2.960 | 3.233 | 3.263 | 3.080 | 3.028 | 3.044 | 3.121 | 3.101 | 3.028 | 2.781 | 2.649 | 2.714 |
| 2014 | 2.767 | NA | 3.060 | 3.007 | 3.062 | 3.152 | 3.105 | 2.900 | 2.921 | 2.714 | 2.308 | 1.868 |
| 2015 | 1.481 | 1.728 | 1.910 | 1.932 | 2.176 | 2.356 | 2.452 | 2.035 | 1.746 | 1.680 | 1.505 | 1.459 |
| 2016 | 1.309 | 1.140 | 1.421 | 1.526 | 1.658 | 1.753 | 1.576 | 1.575 | 1.592 | 1.669 | 1.539 | 1.615 |
| 2017 | 1.761 | 1.793 | 1.756 | 1.821 | 1.777 | 1.730 | 1.757 | 1.845 | 2.038 | 1.862 | 1.902 | 1.819 |
| 2018 | 1.992 | 1.982 | 2.013 | 2.189 | 2.315 | 2.226 | 2.255 | 2.215 | 2.263 | 2.249 | 1.825 | 1.594 |
| 2019 | 1.548 | 1.721 | 2.011 | 2.325 | 2.240 | 1.995 | 2.182 | 1.970 | 2.096 | 2.021 | 1.949 | 1.836 |
| 2020 | 1.887 | 1.814 | 1.236 | 0.683 | 1.028 | 1.277 | 1.336 | 1.341 | 1.309 | 1.242 | 1.189 | 1.391 |
| 2021 | 1.551 | 1.803 | 2.051 | 2.095 | 2.203 | 2.289 | 2.377 | 2.420 | 2.323 | 2.513 | 2.360 | 2.260 |
| 2022 | 2.442 | 2.754 | 3.369 | |||||||||
| - = No Data Reported; -- = Not Applicable; NA = Not Available; W = Withheld to avoid disclosure of individual company data. |
| Release Date: 6/1/2022 |
| Next Release Date: TBD |