|
Download Data (XLS File) |
|
||||||||
|
||||||||
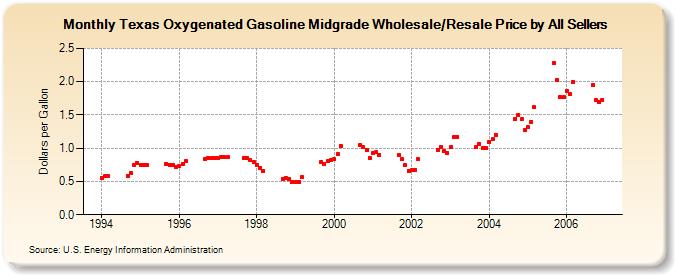
| Texas Oxygenated Gasoline Midgrade Wholesale/Resale Price by All Sellers (Dollars per Gallon) | ||||||||
| Year | Jan | Feb | Mar | Apr | May | Jun | Jul | Aug | Sep | Oct | Nov | Dec |
|---|---|---|---|---|---|---|---|---|---|---|---|---|
| 1994 | 0.554 | 0.577 | 0.588 | W | W | W | W | W | 0.588 | 0.634 | 0.753 | 0.780 |
| 1995 | 0.752 | 0.741 | 0.748 | W | - | - | - | - | 0.767 | 0.748 | 0.742 | 0.721 |
| 1996 | 0.733 | 0.761 | 0.801 | W | - | - | - | - | 0.830 | 0.859 | 0.848 | 0.848 |
| 1997 | 0.858 | 0.868 | 0.871 | 0.866 | - | - | - | - | 0.853 | 0.846 | 0.825 | 0.797 |
| 1998 | 0.750 | 0.709 | 0.658 | - | - | - | - | - | 0.541 | 0.558 | 0.539 | 0.487 |
| 1999 | 0.499 | 0.486 | 0.563 | - | - | - | - | - | 0.792 | 0.769 | 0.801 | 0.819 |
| 2000 | 0.831 | 0.914 | 1.031 | W | - | - | - | - | 1.046 | 1.013 | 0.971 | 0.855 |
| 2001 | 0.927 | 0.940 | 0.904 | W | - | - | - | - | 0.896 | 0.830 | 0.741 | 0.659 |
| 2002 | 0.665 | 0.675 | 0.831 | W | - | - | - | - | 0.977 | 1.019 | 0.952 | 0.926 |
| 2003 | 1.016 | 1.163 | 1.173 | NA | - | - | - | - | 1.014 | 1.066 | 1.005 | 1.000 |
| 2004 | 1.098 | 1.133 | 1.205 | - | - | - | - | - | 1.444 | 1.500 | 1.434 | 1.274 |
| 2005 | 1.316 | 1.401 | 1.615 | - | - | - | - | - | 2.277 | 2.025 | 1.775 | 1.764 |
| 2006 | 1.861 | 1.807 | 1.995 | - | - | - | - | - | 1.948 | 1.717 | 1.697 | 1.730 |
| - = No Data Reported; -- = Not Applicable; NA = Not Available; W = Withheld to avoid disclosure of individual company data. |
| Release Date: 6/1/2022 |
| Next Release Date: TBD |