|
Download Data (XLS File) |
|
||||||||
|
||||||||
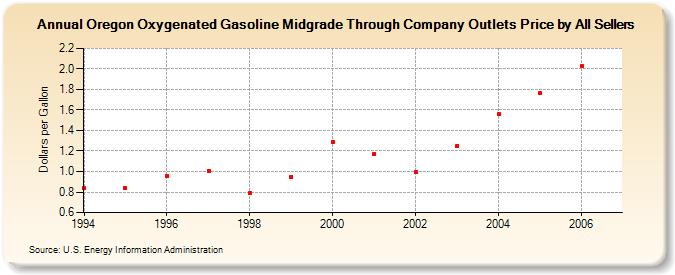
| Oregon Oxygenated Gasoline Midgrade Through Company Outlets Price by All Sellers (Dollars per Gallon) | ||||||||
| Decade | Year-0 | Year-1 | Year-2 | Year-3 | Year-4 | Year-5 | Year-6 | Year-7 | Year-8 | Year-9 |
|---|---|---|---|---|---|---|---|---|---|---|
| 1990's | 0.835 | 0.840 | 0.957 | 1.007 | 0.790 | 0.951 | ||||
| 2000's | 1.287 | 1.174 | 0.993 | 1.249 | 1.558 | 1.764 | 2.026 |
| - = No Data Reported; -- = Not Applicable; NA = Not Available; W = Withheld to avoid disclosure of individual company data. |
| Release Date: 6/1/2022 |
| Next Release Date: TBD |