|
Download Data (XLS File) |
|
||||||||
|
||||||||
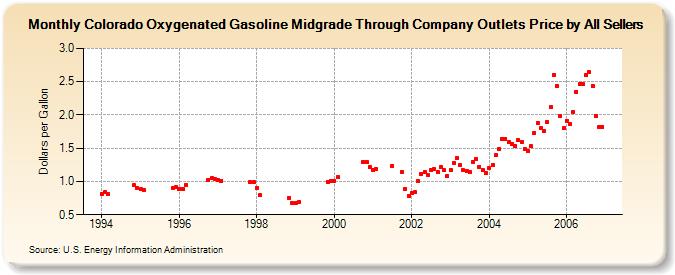
| Colorado Oxygenated Gasoline Midgrade Through Company Outlets Price by All Sellers (Dollars per Gallon) | ||||||||
| Year | Jan | Feb | Mar | Apr | May | Jun | Jul | Aug | Sep | Oct | Nov | Dec |
|---|---|---|---|---|---|---|---|---|---|---|---|---|
| 1994 | 0.816 | 0.836 | 0.809 | W | - | - | - | - | - | W | 0.940 | 0.903 |
| 1995 | 0.889 | 0.869 | W | - | W | W | W | W | W | NA | 0.901 | 0.912 |
| 1996 | 0.894 | 0.890 | 0.953 | - | - | - | - | - | W | 1.023 | 1.051 | 1.031 |
| 1997 | 1.019 | 1.011 | W | W | W | W | W | W | W | W | 0.989 | 0.987 |
| 1998 | 0.908 | 0.789 | - | - | - | - | - | - | - | W | 0.755 | 0.683 |
| 1999 | 0.674 | 0.696 | NA | W | W | W | - | - | - | - | 0.997 | 1.009 |
| 2000 | 1.007 | 1.067 | W | W | W | W | W | W | W | 1.299 | 1.292 | 1.224 |
| 2001 | 1.165 | 1.187 | NA | NA | NA | NA | 1.236 | NA | NA | 1.146 | 0.893 | 0.786 |
| 2002 | 0.833 | 0.835 | 1.006 | 1.115 | 1.141 | 1.103 | 1.170 | 1.186 | 1.144 | 1.216 | 1.166 | 1.084 |
| 2003 | 1.169 | 1.282 | 1.356 | 1.242 | 1.172 | 1.158 | 1.148 | 1.298 | 1.338 | 1.222 | 1.171 | 1.125 |
| 2004 | 1.203 | 1.250 | 1.393 | 1.486 | 1.645 | 1.639 | 1.589 | 1.563 | 1.538 | 1.620 | 1.596 | 1.488 |
| 2005 | 1.452 | 1.528 | 1.728 | 1.881 | 1.804 | 1.753 | 1.897 | 2.118 | 2.606 | 2.434 | 1.980 | 1.797 |
| 2006 | 1.914 | 1.863 | 2.050 | 2.352 | 2.458 | 2.462 | 2.600 | 2.639 | 2.441 | 1.984 | 1.818 | 1.824 |
| - = No Data Reported; -- = Not Applicable; NA = Not Available; W = Withheld to avoid disclosure of individual company data. |
| Release Date: 6/1/2022 |
| Next Release Date: TBD |