|
Download Data (XLS File) |
|
||||||||
|
||||||||
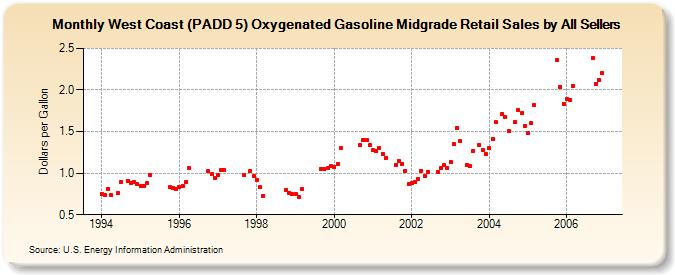
| West Coast (PADD 5) Oxygenated Gasoline Midgrade Retail Sales by All Sellers (Dollars per Gallon) | ||||||||
| Year | Jan | Feb | Mar | Apr | May | Jun | Jul | Aug | Sep | Oct | Nov | Dec |
|---|---|---|---|---|---|---|---|---|---|---|---|---|
| 1994 | 0.748 | 0.740 | 0.813 | 0.735 | W | 0.756 | 0.894 | W | 0.910 | 0.885 | 0.891 | 0.868 |
| 1995 | 0.850 | 0.849 | 0.877 | 0.978 | W | W | W | W | NA | 0.829 | 0.821 | 0.809 |
| 1996 | 0.828 | 0.840 | 0.896 | 1.061 | W | W | W | W | NA | 1.025 | 0.988 | 0.942 |
| 1997 | 0.980 | 1.039 | 1.035 | W | W | W | W | W | 0.983 | NA | 1.020 | 0.965 |
| 1998 | 0.920 | 0.830 | 0.726 | W | W | W | W | W | NA | 0.800 | 0.765 | 0.747 |
| 1999 | 0.751 | 0.715 | 0.807 | W | W | W | W | W | 1.047 | 1.049 | 1.056 | 1.087 |
| 2000 | 1.078 | 1.115 | 1.299 | W | W | W | W | W | 1.337 | 1.403 | 1.396 | 1.335 |
| 2001 | 1.275 | 1.272 | 1.297 | 1.229 | 1.180 | W | W | 1.096 | 1.146 | 1.110 | 1.030 | 0.864 |
| 2002 | 0.878 | 0.896 | 0.932 | 1.030 | 0.964 | 1.013 | NA | NA | 1.017 | 1.058 | 1.096 | 1.066 |
| 2003 | 1.133 | 1.353 | 1.548 | 1.385 | NA | 1.102 | 1.085 | 1.267 | NA | 1.340 | 1.277 | 1.227 |
| 2004 | 1.300 | 1.416 | 1.612 | NA | 1.717 | 1.669 | 1.509 | NA | 1.609 | 1.756 | 1.722 | 1.569 |
| 2005 | 1.479 | 1.600 | 1.815 | W | W | W | W | W | W | 2.361 | 2.039 | 1.835 |
| 2006 | 1.891 | 1.880 | 2.050 | W | W | W | W | W | 2.387 | 2.074 | 2.122 | 2.201 |
| - = No Data Reported; -- = Not Applicable; NA = Not Available; W = Withheld to avoid disclosure of individual company data. |
| Release Date: 6/1/2022 |
| Next Release Date: TBD |