|
Download Data (XLS File) |
|
||||||||
|
||||||||
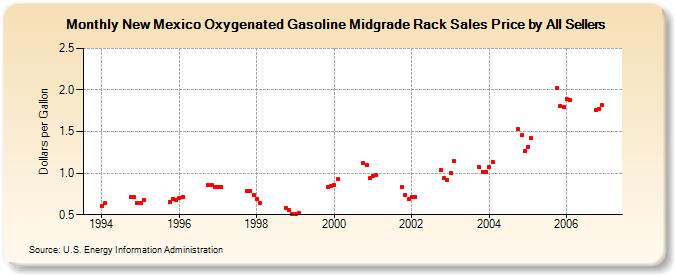
| New Mexico Oxygenated Gasoline Midgrade Rack Sales Price by All Sellers (Dollars per Gallon) | ||||||||
| Year | Jan | Feb | Mar | Apr | May | Jun | Jul | Aug | Sep | Oct | Nov | Dec |
|---|---|---|---|---|---|---|---|---|---|---|---|---|
| 1994 | 0.601 | 0.635 | - | W | - | - | - | - | - | 0.715 | 0.708 | 0.644 |
| 1995 | 0.646 | 0.680 | - | - | - | - | - | - | - | 0.656 | 0.694 | 0.677 |
| 1996 | 0.704 | 0.716 | W | - | - | - | - | - | - | 0.855 | 0.857 | 0.835 |
| 1997 | 0.835 | 0.835 | W | - | - | - | - | - | - | 0.789 | 0.785 | 0.738 |
| 1998 | 0.687 | 0.639 | - | - | - | - | - | - | - | 0.582 | 0.555 | 0.511 |
| 1999 | 0.506 | 0.517 | W | W | - | - | - | - | - | W | 0.837 | 0.848 |
| 2000 | 0.857 | 0.926 | - | - | - | - | - | - | - | 1.121 | 1.092 | 0.936 |
| 2001 | 0.970 | 0.972 | W | - | - | - | - | - | - | 0.839 | 0.743 | 0.684 |
| 2002 | 0.709 | 0.713 | - | - | - | - | - | - | - | 1.036 | 0.938 | 0.918 |
| 2003 | 1.000 | 1.143 | - | - | - | - | - | - | - | 1.069 | 1.014 | 1.017 |
| 2004 | 1.072 | 1.138 | W | - | - | - | - | - | - | 1.526 | 1.455 | 1.263 |
| 2005 | 1.315 | 1.420 | - | - | - | - | - | - | - | 2.029 | 1.811 | 1.795 |
| 2006 | 1.892 | 1.875 | - | - | - | - | - | - | - | 1.764 | 1.777 | 1.815 |
| - = No Data Reported; -- = Not Applicable; NA = Not Available; W = Withheld to avoid disclosure of individual company data. |
| Release Date: 6/1/2022 |
| Next Release Date: TBD |