|
Download Data (XLS File) |
|
||||||||
|
||||||||
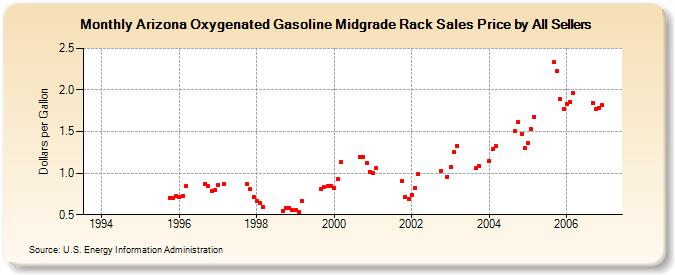
| Arizona Oxygenated Gasoline Midgrade Rack Sales Price by All Sellers (Dollars per Gallon) | ||||||||
| Year | Jan | Feb | Mar | Apr | May | Jun | Jul | Aug | Sep | Oct | Nov | Dec |
|---|---|---|---|---|---|---|---|---|---|---|---|---|
| 1994 | - | - | - | - | - | - | - | - | - | W | W | W |
| 1995 | W | W | W | W | - | - | - | - | W | 0.704 | 0.702 | 0.726 |
| 1996 | 0.712 | 0.726 | 0.845 | - | - | - | - | - | 0.875 | 0.845 | 0.783 | 0.795 |
| 1997 | 0.857 | NA | 0.873 | NA | - | - | - | - | W | 0.869 | 0.807 | 0.713 |
| 1998 | 0.663 | 0.642 | 0.596 | - | - | - | - | - | 0.545 | 0.583 | 0.586 | 0.551 |
| 1999 | 0.556 | 0.532 | 0.660 | W | - | - | - | - | 0.808 | 0.828 | 0.843 | 0.848 |
| 2000 | 0.821 | 0.925 | 1.128 | - | - | - | - | - | 1.193 | 1.196 | 1.127 | 1.017 |
| 2001 | 1.006 | 1.063 | W | - | - | - | - | - | - | 0.900 | 0.714 | 0.691 |
| 2002 | 0.741 | 0.827 | 0.986 | - | - | - | - | - | W | 1.020 | W | 0.959 |
| 2003 | 1.071 | 1.256 | 1.329 | - | - | - | - | - | 1.064 | 1.080 | W | W |
| 2004 | 1.150 | 1.289 | 1.322 | - | - | - | - | - | 1.508 | 1.619 | 1.475 | 1.299 |
| 2005 | 1.361 | 1.527 | 1.680 | - | - | - | - | - | 2.338 | 2.225 | 1.889 | 1.772 |
| 2006 | 1.832 | 1.859 | 1.968 | - | - | - | - | - | 1.848 | 1.766 | 1.788 | 1.818 |
| - = No Data Reported; -- = Not Applicable; NA = Not Available; W = Withheld to avoid disclosure of individual company data. |
| Release Date: 6/1/2022 |
| Next Release Date: TBD |