|
Download Data (XLS File) |
|
||||||||
|
||||||||
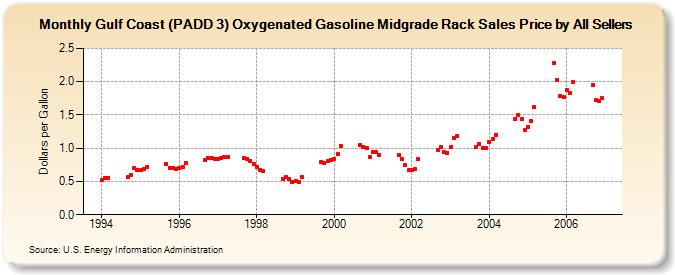
| Gulf Coast (PADD 3) Oxygenated Gasoline Midgrade Rack Sales Price by All Sellers (Dollars per Gallon) | ||||||||
| Year | Jan | Feb | Mar | Apr | May | Jun | Jul | Aug | Sep | Oct | Nov | Dec |
|---|---|---|---|---|---|---|---|---|---|---|---|---|
| 1994 | 0.519 | 0.556 | 0.555 | W | W | W | W | W | 0.562 | 0.604 | 0.701 | 0.670 |
| 1995 | 0.667 | 0.685 | 0.722 | W | - | - | - | - | 0.763 | 0.707 | 0.705 | 0.690 |
| 1996 | 0.709 | 0.720 | 0.781 | - | - | - | - | - | 0.817 | 0.852 | 0.848 | 0.837 |
| 1997 | 0.844 | 0.849 | 0.864 | 0.866 | - | - | - | - | 0.852 | 0.832 | 0.801 | 0.766 |
| 1998 | 0.717 | 0.673 | 0.658 | - | - | - | - | - | 0.541 | 0.560 | 0.544 | 0.495 |
| 1999 | 0.501 | 0.494 | 0.566 | W | - | - | - | - | 0.792 | 0.772 | 0.808 | 0.824 |
| 2000 | 0.839 | 0.916 | 1.031 | W | - | - | - | - | 1.046 | 1.018 | 1.003 | 0.874 |
| 2001 | 0.938 | 0.947 | 0.903 | W | - | - | - | - | 0.896 | 0.832 | 0.742 | 0.667 |
| 2002 | 0.677 | 0.686 | 0.835 | W | - | - | - | - | 0.977 | 1.015 | 0.941 | 0.927 |
| 2003 | 1.016 | 1.158 | 1.176 | - | - | - | - | - | 1.014 | 1.065 | 1.009 | 1.002 |
| 2004 | 1.090 | 1.139 | 1.204 | - | - | - | - | - | 1.444 | 1.502 | 1.438 | 1.272 |
| 2005 | 1.316 | 1.406 | 1.615 | - | - | - | - | - | 2.277 | 2.025 | 1.784 | 1.772 |
| 2006 | 1.870 | 1.824 | 1.995 | - | - | - | - | - | 1.948 | 1.717 | 1.713 | 1.752 |
| - = No Data Reported; -- = Not Applicable; NA = Not Available; W = Withheld to avoid disclosure of individual company data. |
| Release Date: 6/1/2022 |
| Next Release Date: TBD |