|
Download Data (XLS File) |
|
||||||||
|
||||||||
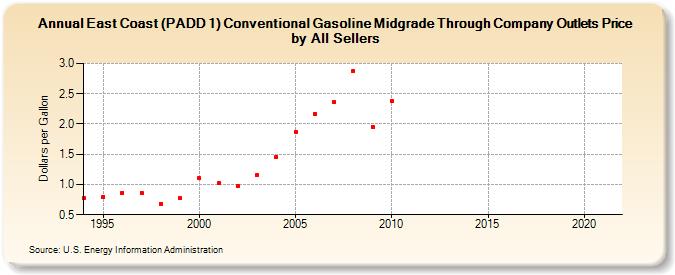
| East Coast (PADD 1) Conventional Gasoline Midgrade Through Company Outlets Price by All Sellers (Dollars per Gallon) | ||||||||
| Decade | Year-0 | Year-1 | Year-2 | Year-3 | Year-4 | Year-5 | Year-6 | Year-7 | Year-8 | Year-9 |
|---|---|---|---|---|---|---|---|---|---|---|
| 1990's | 0.772 | 0.800 | 0.864 | 0.859 | 0.684 | 0.771 | ||||
| 2000's | 1.104 | 1.020 | 0.975 | 1.158 | 1.456 | 1.869 | 2.168 | 2.367 | 2.873 | 1.955 |
| 2010's | 2.379 | - | - | - | - | - | - | - | - | - |
| 2020's | - |
| - = No Data Reported; -- = Not Applicable; NA = Not Available; W = Withheld to avoid disclosure of individual company data. |
| Release Date: 6/1/2022 |
| Next Release Date: TBD |