|
Download Data (XLS File) |
|
||||||||
|
||||||||
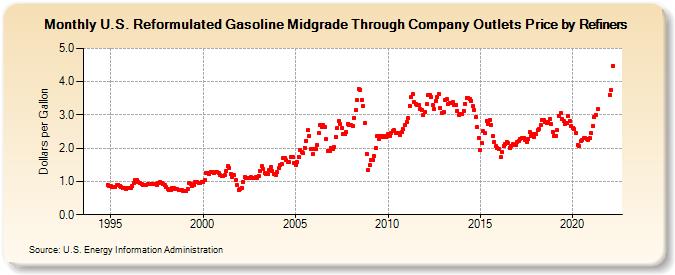
| U.S. Reformulated Gasoline Midgrade Through Company Outlets Price by Refiners (Dollars per Gallon) | ||||||||
| Year | Jan | Feb | Mar | Apr | May | Jun | Jul | Aug | Sep | Oct | Nov | Dec |
|---|---|---|---|---|---|---|---|---|---|---|---|---|
| 1994 | - | - | - | - | - | - | - | - | - | - | 0.898 | 0.878 |
| 1995 | 0.853 | 0.835 | 0.821 | 0.840 | 0.890 | 0.904 | 0.877 | 0.835 | 0.805 | 0.803 | 0.788 | 0.789 |
| 1996 | 0.809 | 0.813 | 0.860 | 0.965 | 1.051 | 1.030 | 0.986 | 0.940 | 0.910 | 0.902 | 0.897 | 0.898 |
| 1997 | 0.921 | 0.926 | 0.918 | 0.925 | 0.925 | 0.911 | 0.896 | 0.950 | 0.981 | 0.960 | 0.927 | 0.893 |
| 1998 | 0.830 | 0.778 | 0.729 | 0.754 | 0.807 | 0.799 | 0.785 | 0.769 | 0.754 | 0.755 | 0.746 | 0.725 |
| 1999 | 0.717 | 0.700 | 0.781 | 0.946 | 0.933 | 0.875 | 0.908 | 0.982 | 0.981 | 0.965 | 0.965 | 0.992 |
| 2000 | 0.998 | 1.057 | 1.249 | 1.243 | 1.213 | 1.278 | 1.288 | 1.241 | 1.298 | 1.283 | 1.263 | 1.200 |
| 2001 | 1.171 | 1.176 | 1.181 | 1.303 | 1.453 | 1.405 | 1.234 | 1.139 | 1.184 | 1.034 | 0.879 | 0.757 |
| 2002 | 0.774 | 0.812 | 0.975 | 1.122 | 1.116 | 1.114 | 1.113 | 1.119 | 1.112 | 1.117 | 1.123 | 1.091 |
| 2003 | 1.171 | 1.329 | 1.452 | 1.374 | 1.263 | 1.225 | 1.225 | 1.353 | 1.435 | 1.303 | 1.233 | 1.191 |
| 2004 | 1.280 | 1.393 | 1.489 | 1.532 | 1.703 | 1.712 | 1.633 | 1.583 | 1.579 | 1.741 | 1.724 | 1.566 |
| 2005 | 1.496 | 1.582 | 1.747 | 1.947 | 1.884 | 1.847 | 2.007 | 2.217 | 2.539 | 2.376 | 1.967 | 1.821 |
| 2006 | 1.972 | 1.967 | 2.089 | 2.451 | 2.688 | 2.646 | 2.712 | 2.647 | 2.276 | 1.930 | 1.913 | 2.014 |
| 2007 | 1.973 | 2.024 | 2.350 | 2.600 | 2.817 | 2.721 | 2.616 | 2.432 | 2.426 | 2.478 | 2.738 | 2.702 |
| 2008 | 2.696 | 2.671 | 2.918 | 3.141 | 3.441 | 3.793 | 3.760 | 3.459 | 3.268 | 2.763 | 1.832 | 1.349 |
| 2009 | 1.481 | 1.632 | 1.638 | 1.768 | 1.995 | 2.356 | 2.284 | 2.379 | 2.367 | 2.326 | 2.360 | 2.326 |
| 2010 | 2.422 | 2.359 | 2.464 | 2.521 | 2.539 | 2.462 | 2.462 | 2.464 | 2.384 | 2.493 | 2.565 | 2.696 |
| 2011 | 2.788 | 2.898 | 3.272 | 3.529 | 3.619 | 3.388 | 3.332 | 3.297 | 3.310 | 3.189 | 3.140 | 2.995 |
| 2012 | 3.097 | 3.315 | 3.606 | 3.597 | 3.548 | 3.288 | 3.164 | 3.429 | 3.538 | 3.630 | 3.195 | 3.048 |
| 2013 | 3.086 | 3.453 | 3.466 | 3.318 | 3.356 | 3.365 | 3.383 | 3.289 | 3.306 | 3.132 | 2.986 | 3.014 |
| 2014 | 3.034 | 3.127 | 3.343 | 3.518 | 3.514 | 3.477 | 3.431 | 3.257 | 3.155 | 2.925 | 2.622 | 2.309 |
| 2015 | 1.958 | 2.143 | 2.503 | 2.450 | 2.826 | 2.736 | 2.862 | 2.701 | 2.358 | 2.181 | 2.057 | 2.011 |
| 2016 | 1.981 | 1.721 | 1.881 | 2.064 | 2.135 | 2.195 | 2.152 | 2.018 | 2.076 | 2.112 | 2.093 | 2.098 |
| 2017 | 2.195 | 2.225 | 2.275 | 2.303 | 2.309 | 2.260 | 2.194 | 2.276 | 2.473 | 2.352 | 2.438 | 2.345 |
| 2018 | 2.437 | 2.534 | 2.572 | 2.684 | 2.849 | 2.840 | 2.781 | 2.764 | 2.791 | 2.873 | 2.713 | 2.496 |
| 2019 | 2.355 | 2.380 | 2.538 | 2.979 | 3.059 | 2.871 | 2.807 | 2.732 | 2.748 | 2.955 | 2.823 | 2.652 |
| 2020 | 2.616 | 2.569 | 2.466 | 2.102 | 2.060 | 2.207 | 2.254 | 2.295 | 2.299 | 2.284 | 2.255 | 2.297 |
| 2021 | 2.451 | 2.672 | 2.930 | 3.006 | 3.166 | W | W | W | W | W | W | W |
| 2022 | 3.607 | 3.735 | 4.481 | |||||||||
| - = No Data Reported; -- = Not Applicable; NA = Not Available; W = Withheld to avoid disclosure of individual company data. |
| Release Date: 6/1/2022 |
| Next Release Date: TBD |