|
Download Data (XLS File) |
|
||||||||
|
||||||||
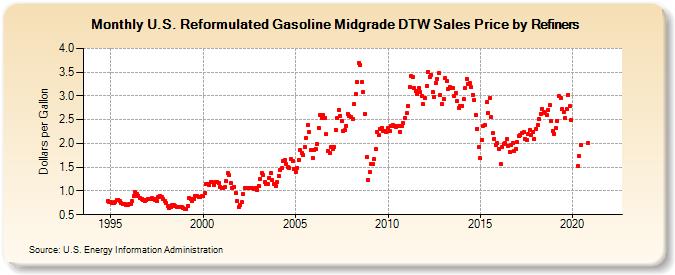
| U.S. Reformulated Gasoline Midgrade DTW Sales Price by Refiners (Dollars per Gallon) | ||||||||
| Year | Jan | Feb | Mar | Apr | May | Jun | Jul | Aug | Sep | Oct | Nov | Dec |
|---|---|---|---|---|---|---|---|---|---|---|---|---|
| 1994 | - | - | - | - | - | - | - | - | - | - | 0.779 | 0.770 |
| 1995 | 0.771 | 0.756 | 0.745 | 0.764 | 0.814 | 0.819 | 0.782 | 0.742 | 0.724 | 0.716 | 0.698 | 0.703 |
| 1996 | 0.723 | 0.731 | 0.779 | 0.888 | 0.968 | 0.940 | 0.903 | 0.851 | 0.823 | 0.805 | 0.796 | 0.805 |
| 1997 | 0.827 | 0.831 | 0.837 | 0.851 | 0.838 | 0.819 | 0.795 | 0.871 | 0.904 | 0.874 | 0.837 | 0.797 |
| 1998 | 0.748 | 0.680 | 0.632 | 0.655 | 0.713 | 0.704 | 0.688 | 0.665 | 0.652 | 0.658 | 0.652 | 0.633 |
| 1999 | 0.628 | 0.612 | 0.685 | 0.859 | 0.840 | 0.782 | 0.822 | 0.895 | 0.893 | 0.880 | 0.872 | 0.891 |
| 2000 | 0.894 | 0.957 | 1.143 | 1.139 | 1.118 | 1.183 | 1.183 | 1.126 | 1.193 | 1.186 | 1.160 | 1.090 |
| 2001 | 1.057 | 1.070 | 1.078 | 1.203 | 1.374 | 1.328 | 1.174 | 1.054 | 1.084 | 0.950 | 0.787 | 0.656 |
| 2002 | 0.705 | 0.759 | 0.926 | 1.067 | 1.058 | 1.061 | 1.060 | 1.072 | 1.058 | 1.042 | 1.059 | 1.025 |
| 2003 | 1.101 | 1.256 | 1.385 | 1.327 | 1.197 | 1.152 | 1.147 | 1.278 | 1.374 | 1.230 | 1.154 | 1.105 |
| 2004 | 1.187 | 1.320 | 1.433 | 1.474 | 1.630 | 1.651 | 1.563 | 1.498 | 1.492 | 1.667 | 1.632 | 1.471 |
| 2005 | 1.396 | 1.493 | 1.661 | 1.863 | 1.800 | 1.760 | 1.917 | 2.109 | 2.391 | 2.239 | 1.866 | 1.699 |
| 2006 | 1.857 | 1.880 | 1.984 | 2.334 | 2.600 | 2.545 | 2.596 | 2.542 | 2.193 | 1.842 | 1.804 | 1.921 |
| 2007 | 1.878 | 1.933 | 2.293 | 2.534 | 2.707 | 2.586 | 2.472 | 2.262 | 2.277 | 2.373 | 2.629 | 2.579 |
| 2008 | 2.557 | 2.524 | 2.826 | 3.033 | 3.288 | 3.698 | 3.648 | 3.292 | 3.091 | 2.626 | 1.708 | 1.231 |
| 2009 | 1.391 | 1.572 | 1.559 | 1.672 | 1.892 | 2.251 | 2.172 | 2.305 | 2.335 | 2.271 | 2.265 | 2.234 |
| 2010 | 2.321 | 2.258 | 2.361 | 2.390 | 2.372 | 2.353 | 2.377 | 2.360 | 2.247 | 2.373 | 2.425 | 2.545 |
| 2011 | 2.634 | 2.788 | 3.192 | 3.426 | 3.397 | 3.165 | 3.097 | 3.036 | 3.171 | 3.079 | 2.991 | 2.823 |
| 2012 | 2.955 | 3.212 | 3.512 | 3.403 | 3.446 | 3.075 | 2.973 | 3.277 | 3.362 | 3.477 | 3.017 | 2.838 |
| 2013 | 2.938 | 3.371 | 3.310 | 3.154 | 3.191 | 3.175 | 3.163 | 2.999 | 3.070 | 2.883 | 2.752 | 2.796 |
| 2014 | 2.797 | 2.927 | 3.158 | 3.356 | 3.261 | 3.268 | 3.179 | 3.022 | 2.915 | 2.601 | 2.314 | 1.916 |
| 2015 | 1.684 | 2.081 | 2.377 | 2.386 | 2.865 | 2.650 | 2.956 | 2.550 | 2.211 | 2.101 | 1.971 | 2.000 |
| 2016 | 1.893 | 1.564 | 1.918 | 1.985 | 2.011 | 2.090 | 1.955 | 1.830 | 1.957 | 2.002 | 1.842 | 1.885 |
| 2017 | 2.020 | 2.151 | 2.180 | 2.217 | 2.231 | 2.101 | 2.082 | 2.189 | 2.286 | 2.186 | 2.235 | 2.101 |
| 2018 | 2.305 | 2.389 | 2.505 | 2.626 | 2.734 | 2.653 | 2.641 | 2.600 | 2.708 | 2.799 | 2.462 | 2.265 |
| 2019 | 2.207 | 2.326 | 2.479 | 2.988 | 2.964 | 2.716 | 2.658 | 2.534 | 2.723 | 3.023 | 2.779 | 2.490 |
| 2020 | W | W | W | 1.519 | 1.732 | 1.967 | W | W | W | W | 2.008 | W |
| 2021 | W | W | W | W | W | W | W | W | W | W | W | W |
| 2022 | W | W | W | |||||||||
| - = No Data Reported; -- = Not Applicable; NA = Not Available; W = Withheld to avoid disclosure of individual company data. |
| Release Date: 6/1/2022 |
| Next Release Date: TBD |