|
Download Data (XLS File) |
|
||||||||
|
||||||||
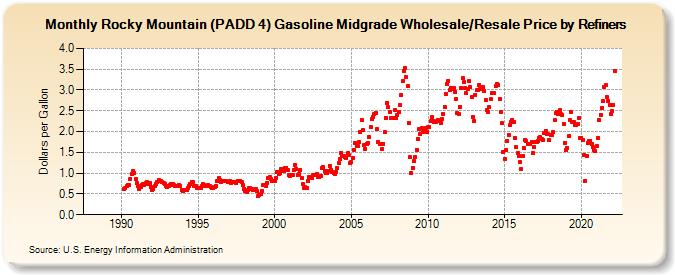
| Rocky Mountain (PADD 4) Gasoline Midgrade Wholesale/Resale Price by Refiners (Dollars per Gallon) | ||||||||
| Year | Jan | Feb | Mar | Apr | May | Jun | Jul | Aug | Sep | Oct | Nov | Dec |
|---|---|---|---|---|---|---|---|---|---|---|---|---|
| 1988 | NA | NA | NA | NA | NA | NA | NA | NA | NA | NA | NA | NA |
| 1989 | W | W | W | W | W | W | W | W | W | W | W | W |
| 1990 | W | W | 0.617 | 0.648 | 0.685 | 0.713 | 0.713 | 0.868 | 0.974 | 1.048 | 1.015 | 0.848 |
| 1991 | 0.760 | 0.699 | 0.627 | 0.678 | 0.715 | 0.737 | 0.716 | 0.766 | 0.777 | 0.739 | 0.765 | 0.673 |
| 1992 | 0.589 | 0.629 | 0.684 | 0.737 | 0.788 | 0.838 | 0.819 | 0.799 | 0.790 | 0.762 | 0.741 | 0.679 |
| 1993 | 0.669 | 0.685 | 0.707 | 0.729 | 0.744 | 0.718 | 0.685 | 0.679 | 0.685 | 0.711 | 0.685 | 0.583 |
| 1994 | 0.564 | 0.590 | 0.585 | 0.596 | 0.633 | 0.687 | 0.731 | 0.795 | 0.777 | 0.698 | 0.685 | 0.635 |
| 1995 | 0.639 | 0.637 | 0.639 | 0.694 | 0.729 | 0.718 | 0.695 | 0.683 | 0.710 | 0.696 | 0.677 | 0.637 |
| 1996 | 0.642 | 0.657 | 0.697 | 0.803 | 0.872 | 0.823 | 0.796 | 0.812 | 0.822 | 0.817 | 0.802 | 0.776 |
| 1997 | 0.790 | 0.802 | 0.774 | 0.789 | 0.796 | 0.789 | 0.764 | 0.808 | 0.814 | 0.806 | 0.791 | 0.715 |
| 1998 | 0.629 | 0.580 | 0.548 | 0.593 | 0.650 | 0.639 | 0.627 | 0.605 | 0.600 | 0.611 | 0.565 | 0.454 |
| 1999 | 0.476 | 0.491 | 0.573 | 0.706 | 0.720 | 0.702 | 0.771 | 0.875 | 0.906 | 0.861 | 0.822 | 0.818 |
| 2000 | 0.815 | 0.894 | 1.038 | 0.972 | 1.005 | 1.106 | 1.087 | 1.051 | 1.121 | 1.132 | 1.077 | 0.949 |
| 2001 | 0.942 | 0.962 | 0.964 | 1.065 | 1.199 | 1.106 | 0.948 | 0.975 | 1.075 | 0.893 | 0.733 | 0.638 |
| 2002 | 0.658 | 0.654 | 0.803 | 0.908 | 0.892 | 0.885 | 0.945 | 0.961 | 0.961 | 0.987 | 0.918 | 0.897 |
| 2003 | 0.942 | 1.114 | 1.147 | 1.046 | 0.994 | 0.996 | 1.057 | 1.179 | 1.086 | 1.035 | 1.015 | 0.980 |
| 2004 | 1.039 | 1.115 | 1.241 | 1.328 | 1.492 | 1.409 | 1.404 | 1.378 | 1.374 | 1.473 | 1.428 | 1.238 |
| 2005 | 1.263 | 1.373 | 1.559 | 1.721 | 1.651 | 1.663 | 1.748 | 1.981 | 2.288 | 2.038 | 1.667 | 1.582 |
| 2006 | 1.705 | 1.726 | 1.861 | 2.108 | 2.297 | 2.350 | 2.419 | 2.447 | 2.061 | 1.759 | 1.704 | 1.710 |
| 2007 | 1.582 | 1.709 | 1.986 | 2.335 | 2.688 | 2.580 | 2.466 | 2.318 | 2.327 | 2.325 | 2.518 | 2.330 |
| 2008 | 2.393 | 2.465 | 2.638 | 2.876 | 3.210 | 3.459 | 3.518 | 3.310 | 3.093 | 2.211 | 1.376 | 1.005 |
| 2009 | 1.134 | 1.288 | 1.396 | 1.557 | 1.827 | 2.053 | 1.940 | 2.091 | 1.987 | 2.006 | 2.075 | 1.988 |
| 2010 | 2.099 | 2.098 | 2.248 | 2.350 | 2.250 | 2.234 | 2.227 | 2.265 | 2.278 | 2.244 | 2.215 | 2.293 |
| 2011 | 2.425 | 2.591 | 2.912 | 3.134 | 3.216 | 3.008 | 3.053 | 3.023 | 3.057 | 2.960 | 2.785 | 2.437 |
| 2012 | 2.431 | 2.598 | 3.046 | 3.277 | 3.185 | 3.046 | 2.917 | 3.030 | 3.209 | 3.066 | 2.819 | 2.344 |
| 2013 | 2.264 | 2.887 | 2.993 | 3.001 | 3.121 | 3.034 | 3.057 | 3.071 | 2.974 | 2.761 | 2.517 | 2.474 |
| 2014 | 2.591 | 2.776 | 2.926 | 2.921 | 2.930 | 3.088 | 3.150 | 3.117 | 2.792 | 2.477 | 2.194 | 1.514 |
| 2015 | 1.344 | 1.545 | 1.771 | 1.920 | 2.151 | 2.236 | 2.281 | 2.235 | 1.848 | 1.626 | 1.484 | 1.422 |
| 2016 | 1.258 | 1.097 | 1.414 | 1.610 | 1.790 | 1.766 | 1.702 | 1.700 | 1.701 | 1.741 | 1.479 | 1.627 |
| 2017 | 1.745 | 1.754 | 1.772 | 1.852 | 1.859 | 1.817 | 1.791 | 1.963 | 2.014 | 1.952 | 1.936 | 1.794 |
| 2018 | 1.916 | 1.917 | 1.980 | 2.269 | 2.441 | 2.474 | 2.414 | 2.509 | 2.415 | 2.402 | 2.185 | 1.727 |
| 2019 | 1.560 | 1.603 | 1.892 | 2.270 | 2.479 | 2.234 | 2.220 | 2.164 | 2.156 | 2.176 | 2.316 | 1.847 |
| 2020 | 1.856 | 1.802 | 1.436 | 0.811 | 1.412 | 1.720 | 1.768 | 1.776 | 1.698 | 1.633 | 1.556 | 1.528 |
| 2021 | 1.659 | 1.854 | 2.282 | 2.405 | 2.567 | 2.724 | 3.083 | 3.113 | 2.824 | 2.743 | 2.639 | 2.427 |
| 2022 | 2.493 | 2.647 | 3.453 | |||||||||
| - = No Data Reported; -- = Not Applicable; NA = Not Available; W = Withheld to avoid disclosure of individual company data. |
| Release Date: 6/1/2022 |
| Next Release Date: TBD |