|
Download Data (XLS File) |
|
||||||||
|
||||||||
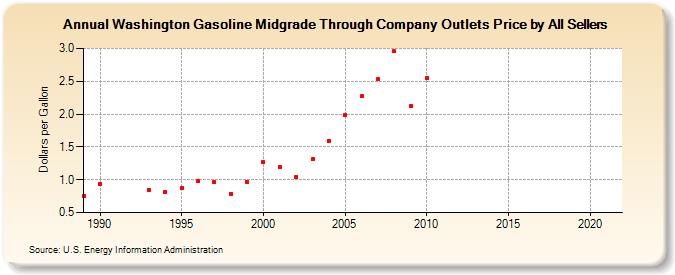
| Washington Gasoline Midgrade Through Company Outlets Price by All Sellers (Dollars per Gallon) | ||||||||
| Decade | Year-0 | Year-1 | Year-2 | Year-3 | Year-4 | Year-5 | Year-6 | Year-7 | Year-8 | Year-9 |
|---|---|---|---|---|---|---|---|---|---|---|
| 1980's | 0.749 | |||||||||
| 1990's | 0.942 | - | W | 0.848 | 0.813 | 0.881 | 0.978 | 0.963 | 0.786 | 0.967 |
| 2000's | 1.268 | 1.194 | 1.047 | 1.311 | 1.596 | 1.981 | 2.269 | 2.530 | 2.953 | 2.125 |
| 2010's | 2.555 | - | - | - | - | - | - | - | - | - |
| 2020's | - |
| - = No Data Reported; -- = Not Applicable; NA = Not Available; W = Withheld to avoid disclosure of individual company data. |
| Release Date: 6/1/2022 |
| Next Release Date: TBD |