|
Download Data (XLS File) |
|
||||||||
|
||||||||
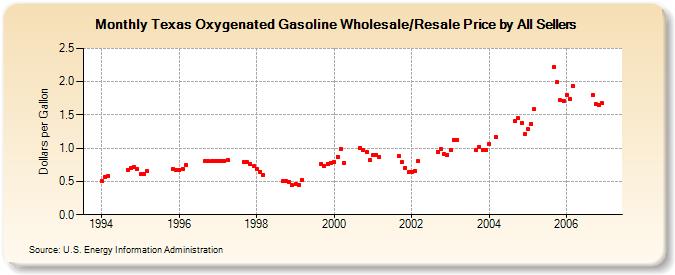
| Texas Oxygenated Gasoline Wholesale/Resale Price by All Sellers (Dollars per Gallon) | ||||||||
| Year | Jan | Feb | Mar | Apr | May | Jun | Jul | Aug | Sep | Oct | Nov | Dec |
|---|---|---|---|---|---|---|---|---|---|---|---|---|
| 1994 | 0.514 | 0.567 | 0.585 | W | W | W | W | W | 0.674 | 0.705 | 0.721 | 0.686 |
| 1995 | 0.612 | 0.618 | 0.659 | NA | - | - | - | W | NA | NA | 0.688 | 0.677 |
| 1996 | 0.678 | 0.691 | 0.750 | W | - | - | - | - | 0.800 | 0.806 | 0.800 | 0.800 |
| 1997 | 0.813 | 0.813 | 0.812 | 0.826 | - | - | - | - | 0.795 | 0.786 | 0.760 | 0.731 |
| 1998 | 0.684 | 0.646 | 0.601 | - | - | - | - | - | 0.505 | 0.512 | 0.492 | 0.443 |
| 1999 | 0.463 | 0.451 | 0.528 | - | - | - | - | - | 0.764 | 0.734 | 0.765 | 0.782 |
| 2000 | 0.793 | 0.873 | 0.995 | 0.780 | - | - | - | - | 1.008 | 0.979 | 0.940 | 0.824 |
| 2001 | 0.892 | 0.904 | 0.872 | W | W | - | - | - | 0.880 | 0.799 | 0.706 | 0.640 |
| 2002 | 0.643 | 0.653 | 0.800 | W | - | - | - | - | 0.949 | 0.990 | 0.918 | 0.899 |
| 2003 | 0.978 | 1.128 | 1.130 | W | NA | NA | NA | NA | 0.977 | 1.022 | 0.968 | 0.970 |
| 2004 | 1.066 | NA | 1.169 | W | - | - | - | - | 1.410 | 1.450 | 1.379 | 1.214 |
| 2005 | 1.283 | 1.368 | 1.583 | - | - | - | - | NA | 2.223 | 1.989 | 1.717 | 1.710 |
| 2006 | 1.805 | 1.737 | 1.935 | - | - | - | - | - | 1.803 | 1.657 | 1.649 | 1.673 |
| - = No Data Reported; -- = Not Applicable; NA = Not Available; W = Withheld to avoid disclosure of individual company data. |
| Release Date: 6/1/2022 |
| Next Release Date: TBD |