|
Download Data (XLS File) |
|
||||||||
|
||||||||
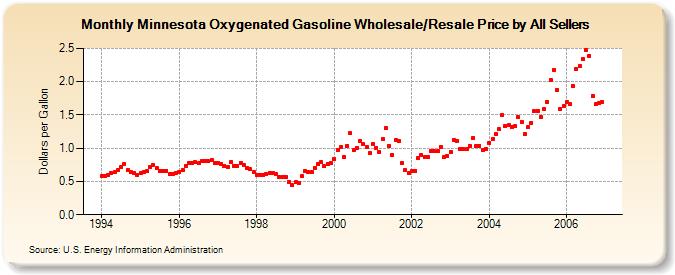
| Minnesota Oxygenated Gasoline Wholesale/Resale Price by All Sellers (Dollars per Gallon) | ||||||||
| Year | Jan | Feb | Mar | Apr | May | Jun | Jul | Aug | Sep | Oct | Nov | Dec |
|---|---|---|---|---|---|---|---|---|---|---|---|---|
| 1994 | 0.577 | 0.588 | 0.598 | 0.626 | 0.638 | 0.670 | 0.718 | 0.765 | 0.671 | 0.638 | 0.632 | 0.597 |
| 1995 | 0.622 | 0.641 | 0.651 | 0.711 | 0.744 | 0.697 | 0.651 | 0.654 | 0.661 | 0.609 | 0.614 | 0.631 |
| 1996 | 0.646 | 0.669 | 0.735 | 0.780 | 0.784 | 0.787 | 0.773 | 0.806 | 0.808 | 0.802 | 0.815 | 0.772 |
| 1997 | 0.775 | 0.765 | 0.739 | 0.719 | 0.786 | 0.738 | 0.730 | 0.784 | 0.740 | 0.703 | 0.682 | 0.641 |
| 1998 | 0.594 | 0.600 | 0.590 | 0.607 | 0.634 | 0.621 | 0.613 | 0.568 | 0.571 | 0.565 | 0.496 | 0.441 |
| 1999 | 0.485 | 0.484 | 0.581 | 0.655 | 0.643 | 0.639 | 0.705 | 0.761 | 0.788 | 0.730 | 0.766 | 0.780 |
| 2000 | 0.836 | 0.967 | 1.013 | 0.866 | 1.039 | 1.222 | 0.968 | 1.008 | 1.113 | 1.059 | 1.017 | 0.924 |
| 2001 | 1.066 | 1.009 | 0.944 | 1.139 | 1.306 | 1.033 | 0.897 | 1.125 | 1.106 | 0.780 | 0.671 | 0.622 |
| 2002 | 0.652 | 0.664 | 0.857 | 0.895 | 0.867 | 0.874 | 0.951 | 0.954 | 0.951 | 1.021 | 0.863 | 0.886 |
| 2003 | 0.942 | 1.128 | 1.107 | 0.991 | 0.985 | 0.988 | 1.038 | 1.155 | 1.029 | 1.040 | 0.973 | 0.992 |
| 2004 | 1.084 | 1.137 | 1.212 | 1.284 | 1.494 | 1.332 | 1.341 | 1.311 | 1.332 | 1.465 | 1.401 | 1.206 |
| 2005 | 1.316 | 1.381 | 1.553 | 1.565 | 1.467 | 1.594 | 1.692 | 2.026 | 2.179 | 1.878 | 1.591 | 1.631 |
| 2006 | 1.692 | 1.661 | 1.931 | 2.194 | 2.230 | 2.335 | 2.478 | 2.387 | 1.786 | 1.658 | 1.677 | 1.697 |
| - = No Data Reported; -- = Not Applicable; NA = Not Available; W = Withheld to avoid disclosure of individual company data. |
| Release Date: 6/1/2022 |
| Next Release Date: TBD |