|
Download Data (XLS File) |
|
||||||||
|
||||||||
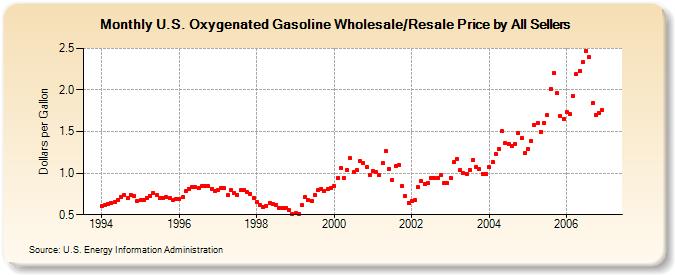
| U.S. Oxygenated Gasoline Wholesale/Resale Price by All Sellers (Dollars per Gallon) | ||||||||
| Year | Jan | Feb | Mar | Apr | May | Jun | Jul | Aug | Sep | Oct | Nov | Dec |
|---|---|---|---|---|---|---|---|---|---|---|---|---|
| 1994 | 0.603 | 0.615 | 0.624 | 0.636 | 0.652 | 0.673 | 0.709 | 0.740 | 0.698 | 0.732 | 0.731 | 0.665 |
| 1995 | 0.672 | 0.673 | 0.705 | 0.730 | 0.767 | 0.736 | 0.701 | 0.704 | 0.709 | 0.698 | 0.682 | 0.685 |
| 1996 | 0.685 | 0.707 | 0.781 | 0.814 | 0.832 | 0.832 | 0.818 | 0.842 | 0.847 | 0.840 | 0.813 | 0.782 |
| 1997 | 0.803 | 0.822 | 0.817 | 0.733 | 0.793 | 0.756 | 0.738 | 0.794 | 0.795 | 0.769 | 0.754 | 0.703 |
| 1998 | 0.647 | 0.617 | 0.587 | 0.604 | 0.638 | 0.627 | 0.619 | 0.581 | 0.584 | 0.584 | 0.552 | 0.503 |
| 1999 | 0.517 | 0.508 | 0.611 | 0.709 | 0.675 | 0.664 | 0.733 | 0.793 | 0.813 | 0.789 | 0.809 | 0.821 |
| 2000 | 0.844 | 0.939 | 1.058 | 0.947 | 1.039 | 1.178 | 1.012 | 1.036 | 1.140 | 1.119 | 1.076 | 0.975 |
| 2001 | 1.021 | 1.012 | 0.973 | 1.117 | 1.261 | 1.051 | 0.917 | 1.082 | 1.094 | 0.847 | 0.728 | 0.644 |
| 2002 | 0.664 | 0.675 | 0.833 | 0.901 | 0.875 | 0.881 | 0.945 | 0.945 | 0.939 | 0.979 | 0.883 | 0.881 |
| 2003 | 0.943 | 1.130 | 1.172 | 1.032 | 0.996 | 0.995 | 1.036 | 1.160 | 1.070 | 1.044 | 0.990 | 0.985 |
| 2004 | 1.075 | 1.133 | 1.232 | 1.296 | 1.503 | 1.359 | 1.356 | 1.323 | 1.354 | 1.486 | 1.425 | 1.239 |
| 2005 | 1.294 | 1.387 | 1.579 | 1.602 | 1.500 | 1.600 | 1.695 | 2.014 | 2.205 | 1.959 | 1.687 | 1.646 |
| 2006 | 1.732 | 1.707 | 1.926 | 2.189 | 2.228 | 2.332 | 2.472 | 2.392 | 1.842 | 1.702 | 1.719 | 1.754 |
| - = No Data Reported; -- = Not Applicable; NA = Not Available; W = Withheld to avoid disclosure of individual company data. |
| Release Date: 6/1/2022 |
| Next Release Date: TBD |