|
Download Data (XLS File) |
|
||||||||
|
||||||||
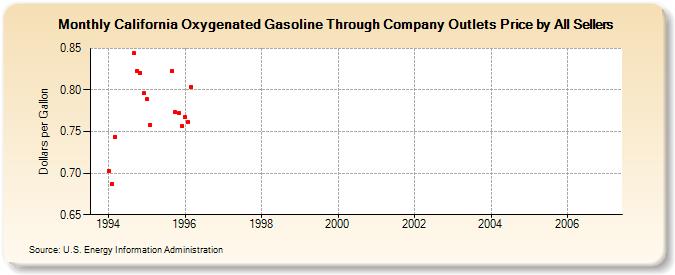
| California Oxygenated Gasoline Through Company Outlets Price by All Sellers (Dollars per Gallon) | ||||||||
| Year | Jan | Feb | Mar | Apr | May | Jun | Jul | Aug | Sep | Oct | Nov | Dec |
|---|---|---|---|---|---|---|---|---|---|---|---|---|
| 1994 | 0.703 | 0.687 | 0.744 | W | W | W | W | W | 0.844 | 0.823 | 0.821 | 0.796 |
| 1995 | 0.789 | 0.758 | W | W | - | W | W | W | 0.823 | 0.773 | 0.772 | 0.757 |
| 1996 | 0.767 | 0.761 | 0.804 | - | - | - | - | - | - | - | - | W |
| 1997 | W | - | - | - | - | - | - | - | - | - | - | - |
| 1998 | - | - | - | - | - | - | - | - | - | - | - | - |
| 1999 | - | - | - | - | - | - | - | - | - | - | - | - |
| 2000 | - | - | - | - | - | - | - | - | - | - | - | - |
| 2001 | - | - | - | - | - | - | - | - | - | - | - | - |
| 2002 | - | - | - | - | - | - | - | - | - | - | - | - |
| 2003 | - | - | - | - | - | - | - | - | - | - | - | - |
| 2004 | - | - | - | - | - | - | - | - | - | - | - | - |
| 2005 | - | - | - | - | - | - | - | - | - | - | - | - |
| 2006 | - | - | - | - | - | - | - | - | - | - | - | - |
| - = No Data Reported; -- = Not Applicable; NA = Not Available; W = Withheld to avoid disclosure of individual company data. |
| Release Date: 6/1/2022 |
| Next Release Date: TBD |