|
Download Data (XLS File) |
|
||||||||
|
||||||||
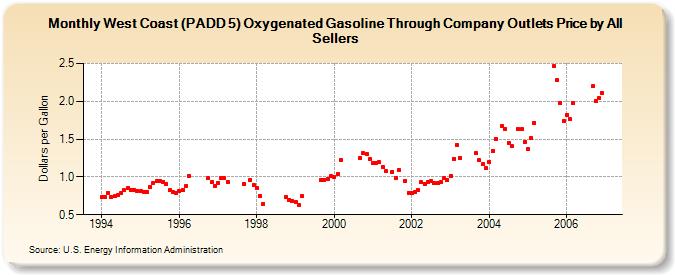
| West Coast (PADD 5) Oxygenated Gasoline Through Company Outlets Price by All Sellers (Dollars per Gallon) | ||||||||
| Year | Jan | Feb | Mar | Apr | May | Jun | Jul | Aug | Sep | Oct | Nov | Dec |
|---|---|---|---|---|---|---|---|---|---|---|---|---|
| 1994 | 0.735 | 0.728 | 0.791 | 0.734 | 0.743 | 0.762 | 0.785 | 0.823 | 0.851 | 0.832 | 0.833 | 0.817 |
| 1995 | 0.811 | 0.801 | 0.804 | 0.872 | 0.921 | 0.942 | 0.943 | 0.935 | 0.904 | 0.823 | 0.800 | 0.793 |
| 1996 | 0.808 | 0.821 | 0.874 | 1.015 | W | W | W | W | NA | 0.982 | 0.932 | 0.882 |
| 1997 | 0.923 | 0.985 | 0.980 | 0.939 | W | W | W | W | 0.911 | NA | 0.953 | 0.892 |
| 1998 | 0.851 | 0.748 | 0.646 | W | W | W | W | W | W | 0.739 | 0.699 | 0.683 |
| 1999 | 0.670 | 0.633 | 0.742 | W | W | W | W | W | 0.955 | 0.960 | 0.977 | 1.008 |
| 2000 | 1.000 | 1.040 | 1.225 | W | W | W | W | W | 1.249 | 1.316 | 1.301 | 1.234 |
| 2001 | 1.182 | 1.178 | 1.193 | 1.128 | 1.072 | W | 1.065 | 0.989 | 1.093 | NA | 0.950 | 0.792 |
| 2002 | 0.788 | 0.795 | 0.824 | 0.928 | 0.910 | 0.935 | 0.945 | 0.915 | 0.917 | 0.934 | 0.985 | 0.954 |
| 2003 | 1.014 | 1.243 | 1.425 | 1.248 | W | W | W | W | 1.310 | 1.218 | 1.165 | 1.112 |
| 2004 | 1.202 | 1.338 | 1.501 | NA | 1.671 | 1.635 | 1.451 | 1.406 | NA | 1.634 | 1.629 | 1.459 |
| 2005 | 1.374 | 1.509 | 1.717 | W | W | W | W | W | 2.463 | 2.276 | 1.977 | 1.739 |
| 2006 | 1.819 | 1.764 | 1.975 | W | W | W | W | W | 2.197 | 2.007 | 2.039 | 2.112 |
| - = No Data Reported; -- = Not Applicable; NA = Not Available; W = Withheld to avoid disclosure of individual company data. |
| Release Date: 6/1/2022 |
| Next Release Date: TBD |