|
Download Data (XLS File) |
|
||||||||
|
||||||||
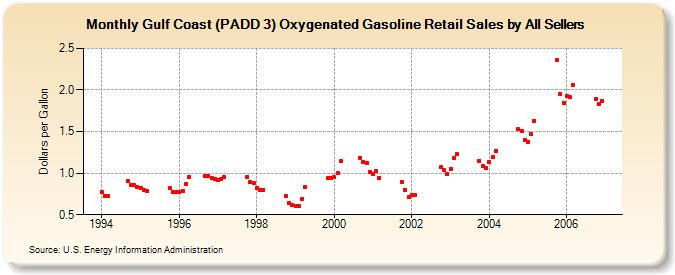
| Gulf Coast (PADD 3) Oxygenated Gasoline Retail Sales by All Sellers (Dollars per Gallon) | ||||||||
| Year | Jan | Feb | Mar | Apr | May | Jun | Jul | Aug | Sep | Oct | Nov | Dec |
|---|---|---|---|---|---|---|---|---|---|---|---|---|
| 1994 | 0.773 | 0.730 | 0.731 | W | W | W | W | W | 0.906 | 0.862 | 0.853 | 0.834 |
| 1995 | 0.826 | 0.792 | 0.787 | W | W | W | W | W | NA | 0.818 | 0.779 | 0.771 |
| 1996 | 0.770 | 0.784 | 0.873 | 0.958 | W | W | W | W | 0.964 | 0.970 | 0.939 | 0.927 |
| 1997 | 0.922 | 0.932 | 0.955 | W | W | W | W | W | W | 0.950 | 0.893 | 0.876 |
| 1998 | 0.819 | 0.800 | 0.799 | W | W | W | W | - | W | 0.728 | 0.642 | 0.619 |
| 1999 | 0.608 | 0.601 | 0.690 | 0.835 | W | W | NA | NA | W | NA | 0.943 | 0.944 |
| 2000 | 0.948 | 0.997 | 1.143 | W | W | W | W | W | 1.186 | 1.136 | 1.123 | 1.014 |
| 2001 | 0.991 | 1.024 | 0.942 | W | W | W | W | W | W | 0.899 | 0.797 | 0.712 |
| 2002 | 0.736 | 0.733 | W | W | W | W | W | W | W | 1.068 | 1.037 | 0.992 |
| 2003 | 1.054 | 1.183 | 1.227 | W | W | W | W | W | W | 1.149 | 1.081 | 1.057 |
| 2004 | 1.138 | 1.197 | 1.261 | W | W | W | W | W | W | 1.525 | 1.512 | 1.404 |
| 2005 | 1.371 | 1.466 | 1.631 | W | W | W | W | W | W | 2.359 | 1.952 | 1.838 |
| 2006 | 1.931 | 1.912 | 2.062 | W | W | W | W | W | W | 1.886 | 1.837 | 1.865 |
| - = No Data Reported; -- = Not Applicable; NA = Not Available; W = Withheld to avoid disclosure of individual company data. |
| Release Date: 6/1/2022 |
| Next Release Date: TBD |