|
Download Data (XLS File) |
|
||||||||
|
||||||||
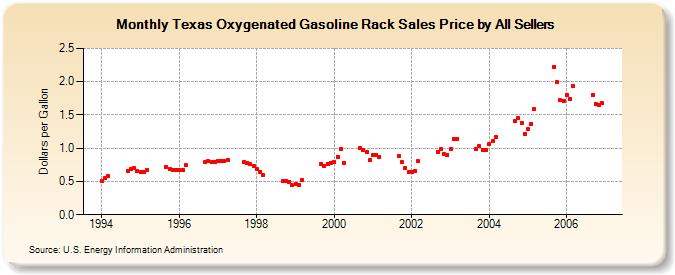
| Texas Oxygenated Gasoline Rack Sales Price by All Sellers (Dollars per Gallon) | ||||||||
| Year | Jan | Feb | Mar | Apr | May | Jun | Jul | Aug | Sep | Oct | Nov | Dec |
|---|---|---|---|---|---|---|---|---|---|---|---|---|
| 1994 | 0.512 | 0.550 | 0.577 | W | W | W | W | W | 0.658 | 0.685 | 0.700 | 0.656 |
| 1995 | 0.640 | 0.642 | 0.671 | NA | - | - | - | W | 0.719 | 0.690 | 0.679 | 0.673 |
| 1996 | 0.670 | 0.675 | 0.740 | - | - | - | - | - | 0.793 | 0.800 | 0.792 | 0.793 |
| 1997 | 0.809 | 0.810 | 0.807 | 0.826 | - | - | - | - | 0.794 | 0.783 | 0.756 | 0.726 |
| 1998 | 0.681 | 0.643 | 0.599 | - | - | - | - | - | 0.505 | 0.514 | 0.492 | 0.443 |
| 1999 | 0.464 | 0.452 | 0.528 | - | - | - | - | - | 0.764 | 0.734 | 0.765 | 0.782 |
| 2000 | 0.793 | 0.873 | 0.995 | 0.780 | - | - | - | - | 1.008 | 0.979 | 0.940 | 0.824 |
| 2001 | 0.893 | 0.905 | 0.873 | W | W | - | - | - | 0.880 | 0.799 | 0.706 | 0.640 |
| 2002 | 0.643 | 0.653 | 0.808 | W | - | - | - | - | 0.949 | 0.984 | 0.910 | 0.900 |
| 2003 | 0.987 | 1.131 | 1.136 | W | - | - | - | - | 0.981 | 1.026 | 0.967 | 0.966 |
| 2004 | 1.061 | 1.102 | 1.166 | - | - | - | - | - | 1.410 | 1.453 | 1.384 | 1.220 |
| 2005 | 1.282 | 1.366 | 1.582 | - | - | - | - | NA | 2.223 | 1.990 | 1.717 | 1.710 |
| 2006 | 1.805 | 1.737 | 1.935 | - | - | - | - | - | 1.803 | 1.657 | 1.649 | 1.673 |
| - = No Data Reported; -- = Not Applicable; NA = Not Available; W = Withheld to avoid disclosure of individual company data. |
| Release Date: 6/1/2022 |
| Next Release Date: TBD |