|
Download Data (XLS File) |
|
||||||||
|
||||||||
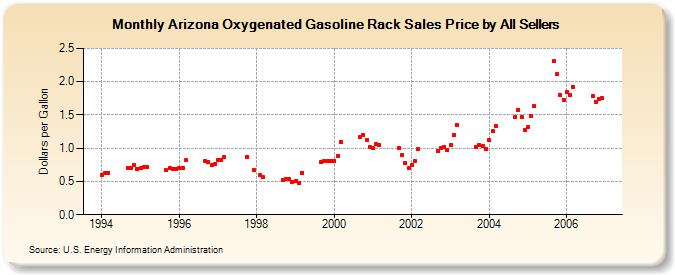
| Arizona Oxygenated Gasoline Rack Sales Price by All Sellers (Dollars per Gallon) | ||||||||
| Year | Jan | Feb | Mar | Apr | May | Jun | Jul | Aug | Sep | Oct | Nov | Dec |
|---|---|---|---|---|---|---|---|---|---|---|---|---|
| 1994 | 0.596 | 0.621 | 0.633 | W | W | W | - | - | 0.705 | 0.705 | 0.746 | 0.691 |
| 1995 | 0.697 | 0.721 | 0.723 | NA | - | - | - | - | 0.668 | 0.702 | 0.685 | 0.693 |
| 1996 | 0.699 | 0.709 | 0.816 | NA | - | - | - | - | 0.811 | 0.799 | 0.747 | 0.765 |
| 1997 | 0.825 | 0.822 | 0.866 | NA | - | - | - | - | W | 0.869 | NA | 0.675 |
| 1998 | NA | 0.597 | 0.564 | W | - | - | W | W | 0.521 | 0.541 | 0.534 | 0.494 |
| 1999 | 0.510 | 0.481 | 0.631 | W | - | NA | - | - | 0.791 | 0.809 | 0.809 | 0.805 |
| 2000 | 0.810 | 0.890 | 1.091 | - | - | - | - | - | 1.164 | 1.198 | 1.130 | 1.025 |
| 2001 | 0.998 | 1.058 | 1.051 | - | - | - | - | - | 0.999 | 0.898 | 0.775 | 0.696 |
| 2002 | 0.741 | 0.807 | 0.988 | - | - | - | - | - | 0.953 | 0.998 | 1.022 | 0.974 |
| 2003 | 1.053 | 1.201 | 1.347 | - | - | - | - | - | 1.013 | 1.051 | 1.030 | 0.991 |
| 2004 | 1.116 | 1.251 | 1.334 | W | - | - | - | - | 1.472 | 1.581 | 1.473 | 1.276 |
| 2005 | 1.316 | 1.478 | 1.633 | NA | - | - | - | - | 2.306 | 2.108 | 1.798 | 1.727 |
| 2006 | 1.844 | 1.798 | 1.927 | - | - | - | - | - | 1.783 | 1.699 | 1.735 | 1.747 |
| - = No Data Reported; -- = Not Applicable; NA = Not Available; W = Withheld to avoid disclosure of individual company data. |
| Release Date: 6/1/2022 |
| Next Release Date: TBD |