|
Download Data (XLS File) |
|
||||||||
|
||||||||
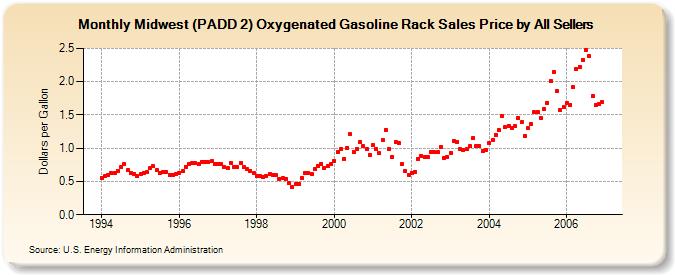
| Midwest (PADD 2) Oxygenated Gasoline Rack Sales Price by All Sellers (Dollars per Gallon) | ||||||||
| Year | Jan | Feb | Mar | Apr | May | Jun | Jul | Aug | Sep | Oct | Nov | Dec |
|---|---|---|---|---|---|---|---|---|---|---|---|---|
| 1994 | 0.553 | 0.584 | 0.594 | 0.620 | 0.631 | 0.663 | 0.713 | 0.760 | 0.665 | 0.620 | 0.612 | 0.581 |
| 1995 | 0.612 | 0.631 | 0.639 | 0.696 | 0.727 | 0.669 | 0.629 | 0.638 | 0.645 | 0.596 | 0.603 | 0.619 |
| 1996 | 0.634 | 0.658 | 0.723 | 0.765 | 0.771 | 0.773 | 0.762 | 0.797 | 0.796 | 0.788 | 0.809 | 0.762 |
| 1997 | 0.766 | 0.757 | 0.722 | 0.704 | 0.774 | 0.721 | 0.713 | 0.775 | 0.719 | 0.683 | 0.662 | 0.620 |
| 1998 | 0.575 | 0.585 | 0.565 | 0.580 | 0.611 | 0.599 | 0.593 | 0.542 | 0.548 | 0.544 | 0.471 | 0.417 |
| 1999 | 0.464 | 0.462 | 0.559 | 0.633 | 0.624 | 0.618 | 0.685 | 0.738 | 0.768 | 0.706 | 0.739 | 0.758 |
| 2000 | 0.810 | 0.941 | 0.983 | 0.842 | 1.010 | 1.207 | 0.950 | 0.993 | 1.089 | 1.032 | 0.993 | 0.902 |
| 2001 | 1.042 | 0.990 | 0.921 | 1.119 | 1.280 | 0.994 | 0.872 | 1.092 | 1.073 | 0.757 | 0.652 | 0.602 |
| 2002 | 0.631 | 0.644 | 0.840 | 0.887 | 0.860 | 0.861 | 0.944 | 0.942 | 0.940 | 1.016 | 0.853 | 0.869 |
| 2003 | 0.922 | 1.110 | 1.097 | 0.981 | 0.975 | 0.982 | 1.029 | 1.152 | 1.026 | 1.030 | 0.959 | 0.976 |
| 2004 | 1.075 | 1.127 | 1.201 | 1.271 | 1.485 | 1.317 | 1.334 | 1.300 | 1.326 | 1.454 | 1.387 | 1.190 |
| 2005 | 1.299 | 1.363 | 1.540 | 1.550 | 1.458 | 1.586 | 1.683 | 2.016 | 2.148 | 1.861 | 1.580 | 1.618 |
| 2006 | 1.682 | 1.652 | 1.920 | 2.188 | 2.225 | 2.330 | 2.479 | 2.383 | 1.784 | 1.655 | 1.671 | 1.692 |
| - = No Data Reported; -- = Not Applicable; NA = Not Available; W = Withheld to avoid disclosure of individual company data. |
| Release Date: 6/1/2022 |
| Next Release Date: TBD |