|
Download Data (XLS File) |
|
||||||||
|
||||||||
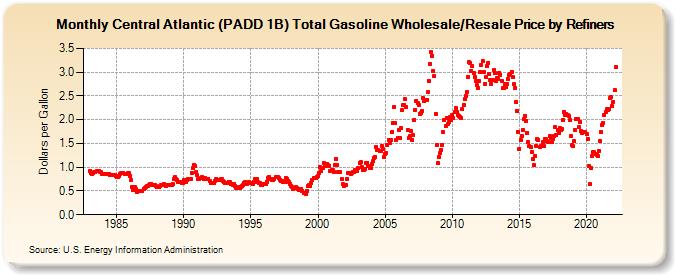
| Central Atlantic (PADD 1B) Total Gasoline Wholesale/Resale Price by Refiners (Dollars per Gallon) | ||||||||
| Year | Jan | Feb | Mar | Apr | May | Jun | Jul | Aug | Sep | Oct | Nov | Dec |
|---|---|---|---|---|---|---|---|---|---|---|---|---|
| 1983 | 0.920 | 0.882 | 0.849 | 0.873 | 0.897 | 0.902 | 0.917 | 0.917 | 0.913 | 0.906 | 0.893 | 0.859 |
| 1984 | 0.854 | 0.858 | 0.855 | 0.859 | 0.856 | 0.851 | 0.836 | 0.827 | 0.836 | 0.838 | 0.826 | 0.807 |
| 1985 | 0.790 | 0.789 | 0.821 | 0.855 | 0.872 | 0.880 | 0.882 | 0.863 | 0.863 | 0.864 | 0.872 | 0.868 |
| 1986 | 0.823 | 0.723 | 0.582 | 0.514 | 0.581 | 0.550 | 0.472 | 0.489 | 0.504 | 0.492 | 0.493 | 0.505 |
| 1987 | 0.548 | 0.566 | 0.583 | 0.596 | 0.611 | 0.629 | 0.654 | 0.655 | 0.629 | 0.631 | 0.630 | 0.599 |
| 1988 | 0.578 | 0.581 | 0.576 | 0.603 | 0.619 | 0.624 | 0.637 | 0.631 | 0.606 | 0.619 | 0.635 | 0.617 |
| 1989 | 0.624 | 0.623 | 0.644 | 0.747 | 0.785 | 0.755 | 0.729 | 0.681 | 0.694 | 0.694 | 0.665 | 0.667 |
| 1990 | 0.736 | 0.722 | 0.696 | 0.720 | 0.744 | 0.753 | 0.753 | 0.877 | 0.978 | 1.048 | 1.035 | 0.903 |
| 1991 | 0.827 | 0.756 | 0.749 | 0.765 | 0.792 | 0.769 | 0.748 | 0.774 | 0.747 | 0.747 | 0.758 | 0.708 |
| 1992 | 0.677 | 0.670 | 0.658 | 0.676 | 0.717 | 0.755 | 0.736 | 0.735 | 0.730 | 0.743 | 0.746 | 0.713 |
| 1993 | 0.690 | 0.670 | 0.661 | 0.676 | 0.692 | 0.681 | 0.654 | 0.647 | 0.627 | 0.644 | 0.613 | 0.558 |
| 1994 | 0.564 | 0.573 | 0.566 | 0.584 | 0.606 | 0.634 | 0.659 | 0.688 | 0.644 | 0.659 | 0.694 | 0.669 |
| 1995 | 0.666 | 0.661 | 0.644 | 0.690 | 0.753 | 0.749 | 0.693 | 0.665 | 0.672 | 0.628 | 0.615 | 0.651 |
| 1996 | 0.651 | 0.649 | 0.694 | 0.770 | 0.796 | 0.748 | 0.744 | 0.728 | 0.735 | 0.756 | 0.789 | 0.800 |
| 1997 | 0.798 | 0.770 | 0.741 | 0.710 | 0.715 | 0.695 | 0.692 | 0.775 | 0.759 | 0.712 | 0.685 | 0.653 |
| 1998 | 0.611 | 0.573 | 0.546 | 0.560 | 0.576 | 0.561 | 0.548 | 0.522 | 0.521 | 0.543 | 0.509 | 0.453 |
| 1999 | 0.457 | 0.440 | 0.498 | 0.596 | 0.616 | 0.605 | 0.663 | 0.738 | 0.775 | 0.766 | 0.776 | 0.798 |
| 2000 | 0.812 | 0.878 | 0.999 | 0.913 | 0.989 | 1.095 | 1.062 | 1.027 | 1.058 | 1.043 | 1.030 | 0.925 |
| 2001 | 0.943 | 0.945 | 0.907 | 1.044 | 1.165 | 1.040 | 0.893 | 0.892 | 0.890 | 0.753 | 0.645 | 0.601 |
| 2002 | 0.626 | 0.631 | 0.750 | 0.872 | 0.873 | 0.853 | 0.883 | 0.895 | 0.902 | 0.932 | 0.910 | 0.921 |
| 2003 | 0.974 | 1.090 | 1.100 | 0.996 | 0.945 | 0.940 | 0.972 | 1.089 | 1.096 | 1.034 | 0.987 | 0.978 |
| 2004 | 1.074 | 1.122 | 1.183 | 1.217 | 1.435 | 1.355 | 1.356 | 1.334 | 1.331 | 1.448 | 1.384 | 1.223 |
| 2005 | 1.279 | 1.304 | 1.462 | 1.576 | 1.516 | 1.582 | 1.735 | 1.936 | 2.276 | 1.927 | 1.581 | 1.624 |
| 2006 | 1.786 | 1.621 | 1.818 | 2.195 | 2.303 | 2.310 | 2.429 | 2.270 | 1.783 | 1.610 | 1.649 | 1.762 |
| 2007 | 1.579 | 1.675 | 1.995 | 2.214 | 2.403 | 2.341 | 2.306 | 2.122 | 2.147 | 2.184 | 2.452 | 2.385 |
| 2008 | 2.418 | 2.420 | 2.574 | 2.823 | 3.180 | 3.425 | 3.344 | 3.022 | 2.910 | 2.119 | 1.462 | 1.085 |
| 2009 | 1.204 | 1.307 | 1.371 | 1.465 | 1.734 | 1.995 | 1.864 | 2.039 | 1.900 | 1.941 | 2.050 | 2.003 |
| 2010 | 2.105 | 2.032 | 2.160 | 2.250 | 2.160 | 2.102 | 2.078 | 2.052 | 2.036 | 2.216 | 2.311 | 2.434 |
| 2011 | 2.505 | 2.578 | 2.894 | 3.212 | 3.189 | 3.027 | 3.127 | 2.986 | 2.902 | 2.808 | 2.721 | 2.659 |
| 2012 | 2.809 | 2.998 | 3.159 | 3.231 | 3.008 | 2.760 | 2.902 | 3.127 | 3.197 | 2.963 | 2.828 | 2.752 |
| 2013 | 2.832 | 3.053 | 2.973 | 2.808 | 2.881 | 2.855 | 2.989 | 2.948 | 2.811 | 2.663 | 2.661 | 2.749 |
| 2014 | 2.679 | 2.750 | 2.847 | 2.945 | 2.955 | 3.005 | 2.891 | 2.743 | 2.673 | 2.362 | 2.179 | 1.742 |
| 2015 | 1.391 | 1.568 | 1.664 | 1.780 | 2.007 | 2.074 | 1.981 | 1.724 | 1.526 | 1.454 | 1.424 | 1.317 |
| 2016 | 1.162 | 1.037 | 1.231 | 1.453 | 1.588 | 1.572 | 1.423 | 1.444 | 1.446 | 1.528 | 1.442 | 1.589 |
| 2017 | 1.595 | 1.543 | 1.521 | 1.653 | 1.613 | 1.523 | 1.589 | 1.659 | 1.836 | 1.673 | 1.782 | 1.710 |
| 2018 | 1.830 | 1.785 | 1.813 | 1.987 | 2.167 | 2.095 | 2.120 | 2.091 | 2.077 | 1.991 | 1.655 | 1.469 |
| 2019 | 1.441 | 1.545 | 1.785 | 2.008 | 2.020 | 1.846 | 1.961 | 1.768 | 1.729 | 1.734 | 1.737 | 1.737 |
| 2020 | 1.694 | 1.593 | 1.031 | 0.643 | 0.993 | 1.233 | 1.325 | 1.318 | 1.285 | 1.253 | 1.235 | 1.349 |
| 2021 | 1.541 | 1.738 | 1.895 | 1.925 | 2.099 | 2.153 | 2.217 | 2.206 | 2.231 | 2.454 | 2.476 | 2.284 |
| 2022 | 2.378 | 2.620 | 3.100 | |||||||||
| - = No Data Reported; -- = Not Applicable; NA = Not Available; W = Withheld to avoid disclosure of individual company data. |
| Release Date: 6/1/2022 |
| Next Release Date: TBD |