|
Download Data (XLS File) |
|
||||||||
|
||||||||
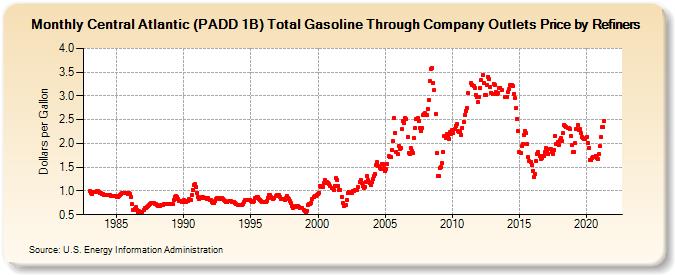
| Central Atlantic (PADD 1B) Total Gasoline Through Company Outlets Price by Refiners (Dollars per Gallon) | ||||||||
| Year | Jan | Feb | Mar | Apr | May | Jun | Jul | Aug | Sep | Oct | Nov | Dec |
|---|---|---|---|---|---|---|---|---|---|---|---|---|
| 1983 | 1.002 | 0.961 | 0.944 | 0.971 | 0.972 | 0.975 | 0.997 | 0.999 | 0.984 | 0.961 | 0.956 | 0.941 |
| 1984 | 0.934 | 0.914 | 0.911 | 0.919 | 0.922 | 0.924 | 0.916 | 0.903 | 0.903 | 0.901 | 0.901 | 0.892 |
| 1985 | 0.872 | 0.864 | 0.885 | 0.916 | 0.936 | 0.949 | 0.961 | 0.962 | 0.952 | 0.950 | 0.941 | 0.947 |
| 1986 | 0.939 | 0.874 | 0.720 | 0.593 | 0.627 | 0.653 | 0.607 | 0.555 | 0.571 | 0.556 | 0.554 | 0.559 |
| 1987 | 0.603 | 0.637 | 0.649 | 0.665 | 0.679 | 0.702 | 0.722 | 0.742 | 0.742 | 0.736 | 0.734 | 0.723 |
| 1988 | 0.710 | 0.692 | 0.675 | 0.683 | 0.697 | 0.711 | 0.719 | 0.728 | 0.723 | 0.716 | 0.719 | 0.719 |
| 1989 | 0.724 | 0.723 | 0.730 | 0.819 | 0.882 | 0.887 | 0.868 | 0.822 | 0.793 | 0.788 | 0.773 | 0.774 |
| 1990 | 0.809 | 0.790 | 0.776 | 0.781 | 0.796 | 0.822 | 0.820 | 0.912 | 1.026 | 1.127 | 1.142 | 1.087 |
| 1991 | 0.962 | 0.869 | 0.829 | 0.844 | 0.870 | 0.874 | 0.851 | 0.853 | 0.858 | 0.832 | 0.843 | 0.815 |
| 1992 | 0.808 | 0.765 | 0.746 | 0.750 | 0.791 | 0.841 | 0.854 | 0.844 | 0.837 | 0.839 | 0.853 | 0.840 |
| 1993 | 0.813 | 0.788 | 0.763 | 0.763 | 0.780 | 0.789 | 0.785 | 0.774 | 0.761 | 0.773 | 0.751 | 0.729 |
| 1994 | 0.706 | 0.704 | 0.694 | 0.694 | 0.704 | 0.735 | 0.767 | 0.809 | 0.813 | 0.802 | 0.811 | 0.814 |
| 1995 | 0.792 | 0.778 | 0.765 | 0.780 | 0.849 | 0.876 | 0.866 | 0.835 | 0.818 | 0.791 | 0.759 | 0.763 |
| 1996 | 0.775 | 0.769 | 0.786 | 0.860 | 0.920 | 0.918 | 0.879 | 0.846 | 0.835 | 0.845 | 0.885 | 0.919 |
| 1997 | 0.923 | 0.906 | 0.868 | 0.837 | 0.827 | 0.833 | 0.818 | 0.861 | 0.898 | 0.862 | 0.824 | 0.786 |
| 1998 | 0.743 | 0.687 | 0.642 | 0.657 | 0.674 | 0.683 | 0.673 | 0.658 | 0.643 | 0.651 | 0.641 | 0.601 |
| 1999 | 0.582 | 0.557 | 0.585 | 0.701 | 0.730 | 0.721 | 0.757 | 0.829 | 0.872 | 0.898 | 0.892 | 0.921 |
| 2000 | 0.930 | 0.965 | 1.110 | 1.081 | 1.073 | 1.169 | 1.233 | 1.177 | 1.187 | 1.173 | 1.138 | 1.096 |
| 2001 | 1.057 | 1.055 | 1.014 | 1.111 | 1.269 | 1.241 | 1.109 | 1.026 | 1.010 | 0.883 | 0.754 | 0.679 |
| 2002 | 0.699 | 0.703 | 0.810 | 0.965 | 0.973 | 0.958 | 0.966 | 0.998 | 1.005 | 1.019 | 1.030 | 1.028 |
| 2003 | 1.074 | 1.187 | 1.231 | 1.173 | 1.097 | 1.062 | 1.079 | 1.191 | 1.308 | 1.224 | 1.159 | 1.127 |
| 2004 | 1.191 | 1.253 | 1.316 | 1.347 | 1.546 | 1.601 | 1.529 | 1.486 | 1.465 | 1.572 | 1.568 | 1.480 |
| 2005 | 1.426 | 1.464 | 1.566 | 1.729 | 1.706 | 1.713 | 1.861 | 2.041 | 2.531 | 2.229 | 1.828 | 1.768 |
| 2006 | 1.936 | 1.874 | 1.912 | 2.294 | 2.470 | 2.439 | 2.533 | 2.511 | 2.144 | 1.800 | 1.771 | 1.894 |
| 2007 | 1.849 | 1.798 | 2.115 | 2.320 | 2.522 | 2.534 | 2.467 | 2.321 | 2.268 | 2.320 | 2.592 | 2.613 |
| 2008 | 2.630 | 2.597 | 2.735 | 2.915 | 3.305 | 3.575 | 3.587 | 3.280 | 3.117 | 2.611 | 1.798 | 1.324 |
| 2009 | 1.306 | 1.476 | 1.499 | 1.586 | 1.826 | 2.161 | 2.116 | 2.191 | 2.149 | 2.099 | 2.232 | 2.199 |
| 2010 | 2.284 | 2.225 | 2.300 | 2.369 | 2.408 | 2.266 | 2.244 | 2.247 | 2.178 | 2.333 | 2.461 | 2.606 |
| 2011 | 2.690 | 2.753 | 3.056 | W | W | 3.272 | 3.240 | 3.219 | 3.165 | 3.024 | 2.970 | 2.862 |
| 2012 | 2.972 | 3.158 | 3.326 | 3.434 | 3.271 | 3.022 | 3.018 | 3.235 | 3.406 | 3.360 | 3.194 | 3.068 |
| 2013 | 3.041 | 3.255 | 3.239 | 3.088 | 3.040 | 3.061 | 3.160 | 3.177 | 3.129 | NA | NA | 2.984 |
| 2014 | 2.970 | 2.976 | 3.086 | 3.143 | 3.226 | 3.226 | 3.206 | 3.037 | 2.950 | 2.752 | 2.523 | 2.259 |
| 2015 | 1.820 | 1.803 | 1.937 | 1.979 | 2.185 | 2.269 | 2.213 | 1.993 | 1.704 | 1.625 | 1.619 | 1.543 |
| 2016 | 1.429 | 1.286 | 1.360 | 1.635 | 1.786 | 1.819 | 1.738 | 1.664 | 1.692 | 1.731 | 1.741 | 1.811 |
| 2017 | 1.901 | 1.822 | 1.779 | 1.886 | 1.875 | 1.823 | 1.788 | 1.862 | 2.155 | 1.987 | 2.036 | 1.974 |
| 2018 | 2.064 | 2.108 | 2.057 | 2.218 | 2.389 | 2.372 | 2.345 | 2.331 | 2.330 | 2.314 | 2.160 | 1.959 |
| 2019 | 1.822 | 1.826 | 2.004 | 2.308 | 2.385 | 2.274 | 2.296 | 2.219 | 2.142 | 2.107 | 2.101 | 2.092 |
| 2020 | 2.126 | 2.016 | 1.904 | 1.656 | 1.643 | 1.697 | 1.717 | 1.714 | 1.745 | 1.698 | 1.671 | 1.769 |
| 2021 | 1.938 | 2.135 | 2.343 | 2.341 | 2.472 | W | W | W | W | W | W | W |
| 2022 | W | W | W | |||||||||
| - = No Data Reported; -- = Not Applicable; NA = Not Available; W = Withheld to avoid disclosure of individual company data. |
| Release Date: 6/1/2022 |
| Next Release Date: TBD |