|
Download Data (XLS File) |
|
||||||||
|
||||||||
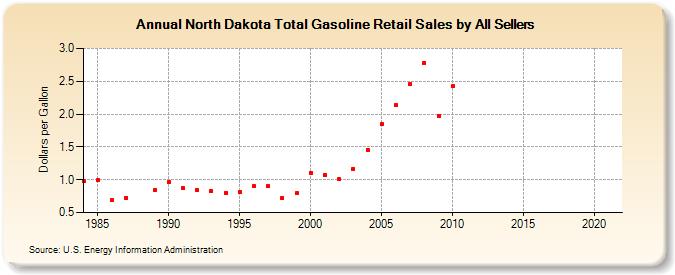
| North Dakota Total Gasoline Retail Sales by All Sellers (Dollars per Gallon) | ||||||||
| Decade | Year-0 | Year-1 | Year-2 | Year-3 | Year-4 | Year-5 | Year-6 | Year-7 | Year-8 | Year-9 |
|---|---|---|---|---|---|---|---|---|---|---|
| 1980's | 0.974 | 0.994 | 0.686 | 0.729 | 0.836 | |||||
| 1990's | 0.962 | 0.870 | 0.837 | 0.826 | 0.804 | 0.815 | 0.899 | 0.897 | 0.719 | 0.792 |
| 2000's | 1.108 | 1.071 | 1.010 | 1.165 | 1.457 | 1.848 | 2.135 | 2.451 | 2.782 | 1.971 |
| 2010's | 2.422 | - | - | - | - | - | - | - | - | - |
| 2020's | - |
| - = No Data Reported; -- = Not Applicable; NA = Not Available; W = Withheld to avoid disclosure of individual company data. |
| Release Date: 6/1/2022 |
| Next Release Date: TBD |