|
Download Data (XLS File) |
|
||||||||
|
||||||||
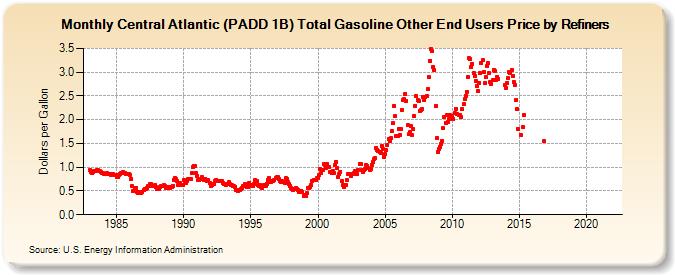
| Central Atlantic (PADD 1B) Total Gasoline Other End Users Price by Refiners (Dollars per Gallon) | ||||||||
| Year | Jan | Feb | Mar | Apr | May | Jun | Jul | Aug | Sep | Oct | Nov | Dec |
|---|---|---|---|---|---|---|---|---|---|---|---|---|
| 1983 | 0.940 | 0.904 | 0.875 | 0.891 | 0.917 | 0.921 | 0.934 | 0.932 | 0.927 | 0.913 | 0.899 | 0.877 |
| 1984 | 0.868 | 0.865 | 0.865 | 0.873 | 0.853 | 0.867 | 0.857 | 0.839 | 0.854 | 0.849 | 0.842 | 0.829 |
| 1985 | 0.800 | 0.797 | 0.828 | 0.866 | 0.885 | 0.886 | 0.898 | 0.876 | 0.863 | 0.865 | 0.867 | 0.861 |
| 1986 | 0.840 | 0.759 | 0.597 | 0.504 | 0.564 | 0.565 | 0.476 | 0.457 | 0.478 | 0.464 | 0.464 | 0.476 |
| 1987 | 0.520 | 0.543 | 0.534 | 0.570 | 0.595 | 0.606 | 0.638 | 0.644 | 0.613 | 0.613 | 0.616 | 0.582 |
| 1988 | 0.550 | 0.553 | 0.550 | 0.584 | 0.603 | 0.609 | 0.629 | 0.610 | 0.571 | 0.573 | 0.571 | 0.581 |
| 1989 | 0.570 | 0.579 | 0.611 | 0.738 | 0.775 | 0.752 | 0.703 | 0.633 | 0.660 | 0.662 | 0.627 | 0.625 |
| 1990 | 0.721 | 0.696 | 0.665 | 0.719 | 0.750 | 0.753 | 0.747 | 0.871 | 0.997 | 1.031 | 1.015 | 0.880 |
| 1991 | 0.820 | 0.735 | 0.721 | 0.754 | 0.785 | 0.750 | 0.729 | 0.753 | 0.726 | 0.707 | 0.724 | 0.661 |
| 1992 | 0.607 | 0.619 | 0.638 | 0.647 | 0.699 | 0.736 | 0.704 | 0.700 | 0.716 | 0.703 | 0.706 | 0.666 |
| 1993 | 0.647 | 0.638 | 0.635 | 0.654 | 0.679 | 0.655 | 0.624 | 0.617 | 0.595 | 0.596 | 0.587 | 0.523 |
| 1994 | 0.498 | 0.526 | 0.518 | 0.540 | 0.567 | 0.595 | 0.604 | 0.643 | 0.575 | 0.578 | 0.659 | 0.601 |
| 1995 | 0.614 | 0.617 | 0.600 | 0.646 | 0.721 | 0.702 | 0.630 | 0.601 | 0.627 | 0.586 | 0.566 | 0.611 |
| 1996 | 0.622 | 0.599 | 0.651 | 0.728 | 0.766 | 0.689 | 0.696 | 0.700 | 0.714 | 0.728 | 0.774 | 0.787 |
| 1997 | 0.784 | 0.748 | 0.716 | 0.696 | 0.702 | 0.689 | 0.677 | 0.764 | 0.743 | 0.698 | 0.650 | 0.614 |
| 1998 | 0.566 | 0.550 | 0.517 | 0.547 | 0.563 | 0.542 | 0.521 | 0.472 | 0.474 | 0.505 | 0.472 | 0.397 |
| 1999 | 0.414 | 0.401 | 0.449 | 0.565 | 0.555 | 0.573 | 0.634 | 0.699 | 0.734 | 0.723 | 0.733 | 0.763 |
| 2000 | 0.763 | 0.836 | 0.953 | 0.877 | 0.950 | 1.069 | 1.045 | 0.992 | 1.063 | 1.000 | 1.012 | 0.898 |
| 2001 | 0.877 | 0.921 | 0.878 | 1.038 | 1.112 | 0.985 | 0.802 | 0.857 | 0.907 | 0.699 | 0.615 | 0.578 |
| 2002 | 0.617 | 0.615 | 0.730 | 0.856 | 0.853 | 0.825 | 0.857 | 0.867 | 0.868 | 0.911 | 0.863 | 0.854 |
| 2003 | 0.949 | 1.073 | 1.060 | 0.937 | 0.908 | 0.937 | 0.958 | 1.052 | 1.033 | 0.977 | 0.947 | 0.964 |
| 2004 | 1.045 | 1.105 | 1.165 | 1.188 | 1.399 | 1.365 | 1.331 | 1.328 | 1.305 | 1.448 | 1.377 | 1.225 |
| 2005 | 1.275 | 1.353 | 1.463 | 1.587 | 1.547 | 1.609 | 1.753 | 1.928 | 2.294 | 2.068 | 1.654 | 1.654 |
| 2006 | 1.804 | 1.685 | 1.798 | 2.210 | 2.406 | 2.429 | 2.543 | 2.397 | 1.884 | 1.693 | 1.733 | 1.862 |
| 2007 | 1.667 | 1.800 | 2.076 | 2.290 | 2.493 | 2.411 | 2.387 | 2.180 | 2.208 | 2.221 | 2.469 | 2.415 |
| 2008 | 2.482 | 2.490 | 2.647 | 2.892 | 3.243 | 3.497 | 3.438 | 3.112 | 3.041 | 2.286 | 1.610 | 1.328 |
| 2009 | 1.392 | 1.435 | 1.494 | 1.553 | 1.817 | 2.059 | 1.929 | 2.091 | 1.950 | 2.022 | 2.095 | 2.040 |
| 2010 | 2.078 | 2.019 | 2.150 | 2.234 | 2.128 | NA | 2.105 | 2.088 | 2.061 | 2.221 | 2.323 | 2.432 |
| 2011 | 2.507 | 2.591 | 2.908 | 3.292 | 3.277 | 3.106 | 3.172 | 2.983 | 2.916 | 2.824 | 2.700 | 2.605 |
| 2012 | 2.772 | 2.973 | 3.183 | 3.246 | 2.998 | 2.770 | 2.906 | 3.139 | 3.183 | 2.973 | 2.793 | 2.754 |
| 2013 | 2.840 | 3.053 | 3.027 | 2.843 | 2.904 | 2.866 | W | NA | NA | NA | NA | 2.727 |
| 2014 | 2.675 | 2.780 | 2.886 | 2.994 | 2.981 | 3.040 | 2.924 | 2.801 | 2.734 | 2.417 | 2.220 | 1.805 |
| 2015 | W | 1.681 | W | 1.837 | 2.101 | W | W | W | W | W | W | W |
| 2016 | W | W | W | W | W | W | W | W | W | W | 1.543 | W |
| 2017 | W | W | W | - | W | - | - | - | - | - | - | - |
| 2018 | - | - | - | W | W | - | - | - | W | - | - | - |
| 2019 | - | - | - | - | - | - | - | - | - | - | - | - |
| 2020 | - | W | - | - | W | - | - | - | - | - | - | - |
| 2021 | - | - | - | - | - | - | - | - | - | - | - | - |
| 2022 | - | - | - | |||||||||
| - = No Data Reported; -- = Not Applicable; NA = Not Available; W = Withheld to avoid disclosure of individual company data. |
| Release Date: 6/1/2022 |
| Next Release Date: TBD |