|
Download Data (XLS File) |
|
||||||||
|
||||||||
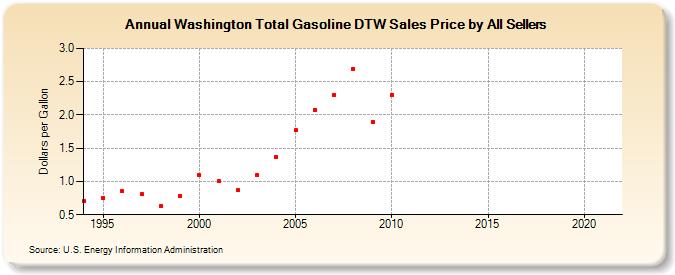
| Washington Total Gasoline DTW Sales Price by All Sellers (Dollars per Gallon) | ||||||||
| Decade | Year-0 | Year-1 | Year-2 | Year-3 | Year-4 | Year-5 | Year-6 | Year-7 | Year-8 | Year-9 |
|---|---|---|---|---|---|---|---|---|---|---|
| 1990's | 0.706 | 0.757 | 0.852 | 0.805 | 0.630 | 0.788 | ||||
| 2000's | 1.095 | 1.002 | 0.865 | 1.092 | 1.368 | 1.767 | 2.078 | 2.301 | 2.695 | 1.898 |
| 2010's | 2.300 | - | - | - | - | - | - | - | - | - |
| 2020's | - |
| - = No Data Reported; -- = Not Applicable; NA = Not Available; W = Withheld to avoid disclosure of individual company data. |
| Release Date: 6/1/2022 |
| Next Release Date: TBD |