|
Download Data (XLS File) |
|
||||||||
|
||||||||
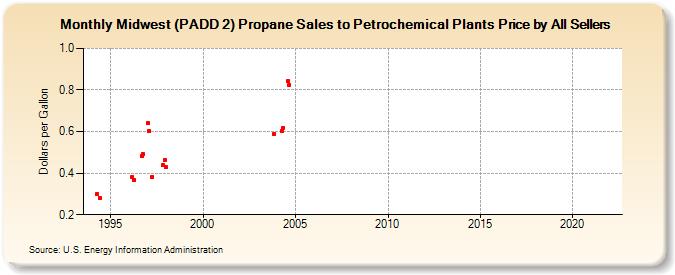
| Midwest (PADD 2) Propane Sales to Petrochemical Plants Price by All Sellers (Dollars per Gallon) | ||||||||
| Year | Jan | Feb | Mar | Apr | May | Jun | Jul | Aug | Sep | Oct | Nov | Dec |
|---|---|---|---|---|---|---|---|---|---|---|---|---|
| 1994 | W | W | W | 0.299 | W | 0.281 | W | W | W | W | W | W |
| 1995 | W | W | W | W | W | W | W | W | W | W | W | W |
| 1996 | W | W | 0.381 | 0.366 | W | W | W | W | 0.483 | 0.491 | W | W |
| 1997 | 0.641 | 0.605 | NA | 0.383 | W | W | W | W | W | W | 0.439 | 0.463 |
| 1998 | 0.428 | W | W | W | W | W | W | W | W | W | - | W |
| 1999 | - | - | - | - | W | W | W | W | W | - | W | W |
| 2000 | - | - | - | - | - | - | - | - | - | W | - | - |
| 2001 | - | - | W | - | - | - | - | W | W | W | W | W |
| 2002 | W | W | W | W | W | W | - | - | - | W | W | W |
| 2003 | W | W | - | - | W | W | W | W | W | W | 0.588 | W |
| 2004 | W | W | W | 0.605 | 0.619 | W | W | 0.843 | 0.824 | W | W | W |
| 2005 | NA | NA | NA | W | W | W | W | W | W | W | W | W |
| 2006 | - | - | W | - | W | W | - | - | - | W | - | - |
| 2007 | - | - | - | - | - | - | - | - | - | - | - | - |
| 2008 | - | - | - | - | - | - | - | - | - | - | - | - |
| 2009 | - | W | - | - | - | - | - | - | - | - | - | W |
| 2010 | W | - | W | - | W | - | - | - | - | - | - | - |
| 2011 | - | - | - | - | - | - | - | - | - | - | - | - |
| 2012 | - | - | - | - | - | - | - | - | - | - | - | - |
| 2013 | - | - | - | - | - | - | - | - | - | - | - | - |
| 2014 | - | - | - | - | - | - | - | - | - | - | - | - |
| 2015 | - | - | - | - | - | - | - | - | - | - | - | - |
| 2016 | - | - | - | - | - | - | - | - | - | - | - | - |
| 2017 | - | - | - | - | - | - | - | - | - | - | - | - |
| 2018 | - | - | - | - | - | - | - | - | - | - | - | - |
| 2019 | - | - | - | - | - | - | - | - | - | - | - | |
| 2020 | - | - | - | - | - | - | - | - | - | - | - | - |
| 2021 | - | - | - | - | - | - | - | - | - | - | - | - |
| 2022 | - | - | - | |||||||||
| - = No Data Reported; -- = Not Applicable; NA = Not Available; W = Withheld to avoid disclosure of individual company data. |
| Release Date: 6/1/2022 |
| Next Release Date: TBD |