|
Download Data (XLS File) |
|
||||||||
|
||||||||
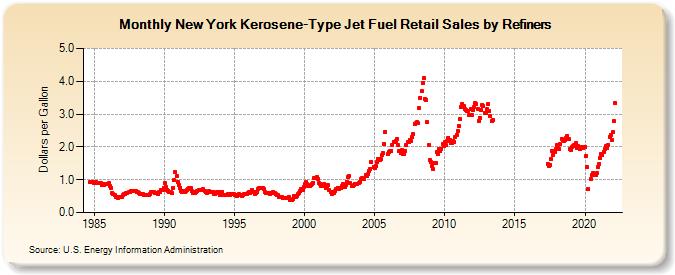
| New York Kerosene-Type Jet Fuel Retail Sales by Refiners (Dollars per Gallon) | ||||||||
| Year | Jan | Feb | Mar | Apr | May | Jun | Jul | Aug | Sep | Oct | Nov | Dec |
|---|---|---|---|---|---|---|---|---|---|---|---|---|
| 1984 | 0.921 | 0.938 | 0.934 | 0.912 | ||||||||
| 1985 | 0.915 | 0.919 | 0.898 | 0.898 | 0.889 | 0.892 | 0.829 | 0.871 | 0.845 | 0.876 | 0.873 | NA |
| 1986 | 0.886 | 0.805 | 0.748 | 0.609 | 0.554 | 0.527 | 0.484 | 0.471 | 0.454 | 0.461 | 0.459 | 0.469 |
| 1987 | 0.523 | 0.556 | 0.559 | 0.582 | 0.595 | 0.618 | 0.637 | 0.655 | 0.657 | 0.664 | 0.669 | 0.663 |
| 1988 | 0.613 | 0.613 | 0.587 | 0.566 | 0.569 | 0.578 | 0.541 | 0.538 | 0.532 | 0.523 | 0.539 | 0.562 |
| 1989 | 0.615 | 0.621 | 0.628 | 0.629 | 0.607 | 0.595 | 0.577 | 0.611 | 0.639 | 0.686 | 0.691 | 0.749 |
| 1990 | 0.898 | 0.784 | 0.696 | 0.665 | 0.635 | 0.612 | 0.598 | 0.750 | 0.984 | 1.231 | 1.121 | 0.941 |
| 1991 | 0.854 | 0.763 | 0.670 | 0.631 | 0.646 | 0.636 | 0.650 | 0.691 | 0.716 | 0.742 | 0.755 | 0.653 |
| 1992 | 0.591 | 0.627 | 0.596 | 0.628 | 0.648 | 0.681 | 0.693 | 0.686 | 0.694 | 0.709 | 0.665 | 0.614 |
| 1993 | 0.608 | 0.624 | 0.642 | 0.627 | 0.623 | 0.612 | 0.575 | 0.560 | 0.593 | 0.620 | 0.627 | 0.548 |
| 1994 | 0.571 | 0.637 | 0.543 | 0.537 | 0.530 | 0.544 | 0.565 | 0.569 | 0.549 | 0.556 | 0.571 | 0.553 |
| 1995 | 0.541 | 0.526 | 0.510 | 0.531 | 0.554 | 0.545 | 0.518 | 0.532 | 0.564 | 0.551 | 0.565 | 0.589 |
| 1996 | 0.622 | 0.593 | 0.628 | 0.698 | 0.621 | 0.574 | 0.592 | 0.629 | 0.703 | 0.749 | 0.743 | 0.760 |
| 1997 | 0.738 | 0.710 | 0.617 | 0.601 | 0.592 | 0.584 | 0.577 | 0.600 | 0.586 | 0.616 | 0.608 | 0.563 |
| 1998 | 0.534 | 0.522 | 0.476 | 0.476 | 0.467 | 0.441 | 0.445 | NA | 0.445 | NA | 0.482 | 0.372 |
| 1999 | 0.396 | 0.376 | 0.412 | 0.490 | 0.487 | 0.511 | 0.555 | 0.606 | 0.650 | 0.718 | 0.698 | 0.775 |
| 2000 | 0.858 | 0.943 | 0.866 | 0.822 | 0.824 | 0.832 | 0.860 | 0.909 | 1.052 | 1.047 | 1.079 | 1.032 |
| 2001 | 0.893 | 0.883 | 0.805 | 0.814 | 0.858 | 0.840 | 0.762 | 0.789 | 0.825 | 0.675 | 0.617 | 0.553 |
| 2002 | 0.613 | 0.601 | 0.657 | 0.720 | 0.752 | 0.715 | 0.751 | 0.762 | 0.820 | 0.868 | 0.793 | 0.830 |
| 2003 | 0.938 | 1.088 | 1.113 | 0.887 | 0.820 | 0.822 | 0.851 | 0.881 | 0.855 | 0.870 | 0.897 | 0.933 |
| 2004 | 1.015 | 1.055 | 1.031 | 1.036 | 1.137 | 1.127 | 1.165 | 1.274 | 1.336 | 1.544 | NA | 1.379 |
| 2005 | 1.343 | 1.414 | 1.532 | 1.639 | 1.592 | 1.636 | 1.741 | 1.811 | 2.085 | 2.461 | NA | 1.779 |
| 2006 | 1.842 | 1.866 | 1.884 | 2.052 | 2.162 | 2.159 | 2.175 | 2.250 | 2.052 | 1.867 | 1.807 | 1.905 |
| 2007 | 1.781 | 1.798 | 1.889 | 2.060 | 2.136 | 2.164 | 2.215 | 2.186 | 2.298 | 2.399 | 2.695 | 2.713 |
| 2008 | 2.750 | 2.722 | 3.179 | 3.498 | 3.696 | 3.946 | 4.095 | 3.469 | 3.421 | 2.748 | 2.063 | 1.604 |
| 2009 | 1.552 | 1.408 | 1.314 | 1.499 | 1.506 | 1.836 | 1.793 | 1.951 | 1.861 | 1.941 | 2.083 | 2.038 |
| 2010 | 2.162 | 2.043 | 2.173 | 2.285 | 2.219 | 2.119 | 2.106 | 2.168 | 2.155 | 2.298 | 2.374 | 2.478 |
| 2011 | 2.639 | 2.838 | 3.209 | 3.310 | 3.243 | 3.165 | 3.123 | 3.108 | 3.087 | 2.983 | 3.143 | 2.974 |
| 2012 | 3.114 | 3.227 | 3.341 | 3.305 | 3.151 | 2.802 | 2.881 | 3.131 | 3.283 | 3.231 | 3.043 | 3.025 |
| 2013 | 3.141 | 3.292 | 3.100 | 2.930 | 2.788 | 2.830 | W | W | W | W | W | W |
| 2014 | W | W | W | W | W | W | W | W | W | W | W | W |
| 2015 | W | W | W | W | W | W | W | W | W | W | W | W |
| 2016 | W | W | W | W | W | W | W | W | W | W | W | W |
| 2017 | W | W | W | W | 1.480 | 1.419 | 1.458 | 1.639 | 1.880 | 1.768 | 1.844 | 1.940 |
| 2018 | 2.062 | 2.000 | 1.932 | 2.088 | 2.253 | 2.225 | 2.185 | 2.212 | 2.270 | 2.333 | 2.241 | 1.935 |
| 2019 | 1.900 | 1.992 | 2.019 | 2.044 | 2.104 | 1.970 | 2.026 | 1.954 | 1.944 | 2.004 | 1.968 | 1.988 |
| 2020 | 2.002 | 1.717 | 1.375 | 0.725 | W | 1.024 | 1.158 | 1.206 | 1.142 | 1.141 | 1.193 | 1.402 |
| 2021 | 1.494 | 1.649 | 1.779 | 1.738 | 1.847 | 1.933 | 2.016 | 1.959 | 2.059 | 2.310 | 2.373 | 2.198 |
| 2022 | 2.441 | 2.788 | 3.333 | |||||||||
| - = No Data Reported; -- = Not Applicable; NA = Not Available; W = Withheld to avoid disclosure of individual company data. |
| Release Date: 6/1/2022 |
| Next Release Date: TBD |