|
Download Data (XLS File) |
|
||||||||
|
||||||||
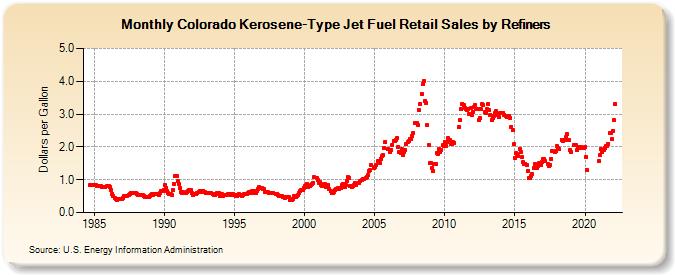
| Colorado Kerosene-Type Jet Fuel Retail Sales by Refiners (Dollars per Gallon) | ||||||||
| Year | Jan | Feb | Mar | Apr | May | Jun | Jul | Aug | Sep | Oct | Nov | Dec |
|---|---|---|---|---|---|---|---|---|---|---|---|---|
| 1984 | 0.842 | 0.842 | 0.840 | 0.839 | ||||||||
| 1985 | 0.831 | 0.834 | 0.820 | 0.815 | 0.812 | 0.803 | 0.777 | 0.770 | 0.777 | 0.784 | 0.796 | 0.812 |
| 1986 | 0.814 | 0.786 | 0.684 | 0.574 | 0.501 | 0.458 | 0.415 | 0.393 | 0.403 | 0.408 | 0.410 | 0.419 |
| 1987 | 0.455 | 0.491 | 0.500 | 0.509 | 0.517 | 0.546 | 0.573 | 0.598 | 0.595 | 0.603 | 0.609 | 0.594 |
| 1988 | 0.569 | 0.550 | 0.539 | 0.524 | 0.525 | 0.531 | 0.497 | 0.485 | 0.480 | 0.465 | 0.467 | 0.498 |
| 1989 | 0.548 | 0.556 | 0.550 | 0.571 | 0.574 | 0.557 | 0.552 | 0.550 | 0.588 | 0.642 | 0.653 | 0.697 |
| 1990 | 0.841 | 0.760 | 0.644 | 0.595 | 0.565 | 0.552 | 0.544 | 0.692 | 0.885 | 1.126 | 1.101 | 0.949 |
| 1991 | 0.870 | 0.742 | 0.639 | 0.606 | 0.611 | 0.604 | 0.604 | 0.637 | 0.662 | 0.680 | 0.699 | 0.602 |
| 1992 | 0.524 | 0.570 | 0.552 | 0.560 | 0.594 | 0.636 | 0.642 | 0.635 | 0.646 | 0.666 | 0.621 | 0.586 |
| 1993 | 0.589 | 0.593 | 0.603 | 0.592 | 0.595 | 0.579 | 0.546 | 0.536 | 0.567 | 0.603 | 0.596 | 0.515 |
| 1994 | 0.526 | 0.553 | 0.508 | 0.526 | 0.523 | 0.533 | 0.552 | 0.563 | 0.555 | 0.548 | 0.562 | 0.526 |
| 1995 | 0.529 | 0.517 | 0.509 | 0.539 | 0.560 | 0.540 | 0.514 | 0.538 | 0.566 | 0.554 | 0.573 | 0.599 |
| 1996 | 0.614 | 0.584 | 0.602 | 0.666 | 0.642 | 0.581 | 0.608 | 0.651 | 0.722 | 0.764 | 0.739 | 0.748 |
| 1997 | 0.726 | 0.714 | 0.641 | 0.627 | 0.618 | 0.598 | 0.586 | 0.589 | 0.589 | 0.604 | NA | 0.577 |
| 1998 | 0.555 | 0.520 | 0.496 | 0.504 | 0.492 | 0.462 | 0.460 | 0.450 | 0.477 | 0.487 | 0.464 | 0.388 |
| 1999 | 0.399 | 0.391 | 0.428 | 0.496 | 0.484 | 0.493 | 0.524 | 0.609 | 0.665 | 0.676 | 0.698 | 0.754 |
| 2000 | 0.814 | 0.841 | 0.857 | 0.787 | 0.801 | 0.825 | 0.858 | 0.904 | 1.075 | NA | 1.051 | 0.992 |
| 2001 | 0.902 | 0.922 | 0.844 | 0.813 | 0.859 | 0.856 | 0.789 | 0.799 | 0.844 | 0.707 | 0.648 | 0.584 |
| 2002 | 0.609 | 0.620 | 0.674 | 0.719 | 0.733 | 0.707 | 0.753 | 0.761 | 0.841 | 0.885 | 0.786 | 0.836 |
| 2003 | 0.967 | 1.087 | 1.062 | 0.824 | 0.783 | 0.815 | 0.849 | 0.894 | 0.853 | NA | 0.914 | 0.950 |
| 2004 | NA | 0.999 | 1.036 | 1.031 | 1.067 | 1.076 | 1.132 | 1.270 | 1.282 | 1.445 | NA | 1.349 |
| 2005 | 1.390 | 1.454 | NA | 1.561 | 1.499 | 1.642 | 1.719 | 1.745 | 1.957 | 2.155 | NA | 1.941 |
| 2006 | NA | 1.853 | 1.916 | 2.064 | 2.181 | 2.173 | 2.206 | 2.264 | 2.003 | 1.857 | 1.815 | 1.933 |
| 2007 | 1.740 | 1.848 | 1.898 | 2.100 | 2.142 | 2.177 | 2.231 | 2.226 | 2.339 | 2.428 | 2.723 | 2.721 |
| 2008 | 2.714 | 2.668 | 3.118 | 3.321 | 3.614 | 3.902 | 4.017 | 3.398 | 3.351 | 2.654 | 2.051 | 1.501 |
| 2009 | 1.513 | 1.364 | 1.275 | 1.489 | 1.493 | 1.819 | 1.779 | 1.929 | 1.847 | 1.919 | 2.057 | 2.037 |
| 2010 | 2.149 | 2.028 | 2.154 | 2.256 | 2.204 | 2.087 | 2.090 | 2.137 | 2.133 | NA | NA | NA |
| 2011 | 2.606 | 2.813 | 3.144 | 3.316 | 3.275 | 3.193 | 3.150 | 3.126 | 3.142 | 3.012 | 3.182 | 2.975 |
| 2012 | 3.065 | 3.202 | 3.271 | 3.155 | 3.143 | 2.807 | 2.879 | 3.153 | 3.300 | 3.279 | 3.053 | 3.044 |
| 2013 | 3.139 | 3.302 | 3.121 | 2.980 | 2.820 | 2.865 | 2.950 | 3.028 | 3.086 | 2.980 | 2.913 | 3.024 |
| 2014 | 3.039 | 3.047 | 3.043 | 2.974 | 2.956 | 2.903 | 2.922 | 2.942 | 2.875 | 2.614 | 2.517 | 2.080 |
| 2015 | 1.664 | 1.803 | 1.788 | 1.730 | 1.941 | 1.848 | 1.683 | 1.531 | 1.464 | 1.489 | 1.463 | 1.265 |
| 2016 | 1.057 | 1.052 | 1.124 | 1.180 | 1.346 | 1.481 | 1.436 | 1.350 | 1.432 | 1.511 | 1.441 | 1.549 |
| 2017 | 1.627 | 1.629 | 1.566 | W | 1.493 | 1.431 | 1.455 | 1.634 | 1.867 | W | 1.834 | 1.885 |
| 2018 | 2.017 | 1.955 | 1.923 | W | 2.217 | 2.189 | 2.207 | 2.201 | 2.290 | 2.380 | 2.201 | 1.899 |
| 2019 | 1.841 | W | W | 2.066 | 2.044 | 1.892 | 2.003 | 1.970 | 1.959 | 1.985 | 1.981 | 1.979 |
| 2020 | 2.000 | 1.701 | 1.287 | W | W | W | W | W | W | W | W | W |
| 2021 | 1.559 | 1.739 | 1.925 | 1.846 | 1.919 | 1.974 | 2.041 | 2.033 | 2.097 | 2.418 | 2.420 | 2.230 |
| 2022 | 2.488 | 2.804 | 3.310 | |||||||||
| - = No Data Reported; -- = Not Applicable; NA = Not Available; W = Withheld to avoid disclosure of individual company data. |
| Release Date: 6/1/2022 |
| Next Release Date: TBD |