|
Download Data (XLS File) |
|
||||||||
|
||||||||
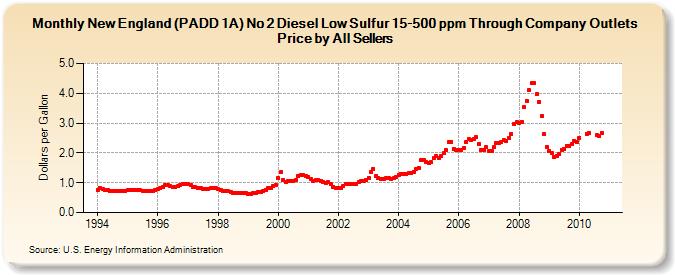
| New England (PADD 1A) No 2 Diesel Low Sulfur 15-500 ppm Through Company Outlets Price by All Sellers (Dollars per Gallon) | ||||||||
| Year | Jan | Feb | Mar | Apr | May | Jun | Jul | Aug | Sep | Oct | Nov | Dec |
|---|---|---|---|---|---|---|---|---|---|---|---|---|
| 1994 | 0.760 | 0.818 | 0.800 | 0.763 | 0.751 | 0.733 | 0.737 | 0.732 | 0.726 | 0.725 | 0.737 | 0.723 |
| 1995 | 0.748 | 0.741 | 0.740 | 0.740 | 0.743 | 0.746 | 0.739 | 0.737 | 0.736 | 0.733 | 0.733 | 0.759 |
| 1996 | 0.790 | 0.810 | 0.866 | 0.931 | 0.908 | 0.885 | 0.850 | 0.851 | 0.881 | 0.936 | 0.947 | 0.959 |
| 1997 | 0.956 | 0.932 | 0.870 | 0.851 | 0.836 | 0.817 | 0.801 | 0.805 | 0.806 | 0.816 | 0.816 | 0.808 |
| 1998 | 0.786 | 0.755 | 0.721 | 0.712 | 0.708 | 0.688 | 0.661 | 0.652 | 0.658 | 0.668 | 0.657 | 0.646 |
| 1999 | 0.637 | 0.626 | 0.640 | 0.669 | 0.677 | 0.696 | 0.727 | 0.769 | 0.816 | 0.839 | 0.898 | 0.937 |
| 2000 | 1.159 | 1.344 | 1.101 | 1.032 | 1.066 | 1.064 | 1.054 | 1.102 | 1.215 | 1.246 | 1.266 | 1.232 |
| 2001 | 1.189 | 1.112 | 1.060 | 1.079 | 1.085 | 1.060 | 1.017 | 0.997 | 1.019 | 0.945 | 0.872 | 0.828 |
| 2002 | 0.827 | 0.830 | 0.905 | 0.952 | 0.963 | 0.946 | 0.959 | 0.963 | 1.023 | 1.054 | 1.049 | 1.081 |
| 2003 | 1.165 | 1.374 | 1.469 | 1.239 | 1.162 | 1.138 | 1.127 | 1.146 | 1.149 | 1.140 | 1.150 | 1.199 |
| 2004 | 1.276 | 1.283 | 1.286 | 1.284 | 1.328 | 1.334 | 1.354 | 1.449 | 1.508 | 1.750 | 1.757 | 1.689 |
| 2005 | 1.677 | 1.685 | 1.817 | 1.883 | 1.836 | 1.910 | 1.981 | 2.082 | 2.362 | 2.381 | 2.146 | 2.090 |
| 2006 | 2.114 | 2.087 | 2.170 | 2.354 | 2.457 | 2.442 | 2.460 | 2.521 | 2.311 | 2.114 | 2.099 | 2.189 |
| 2007 | 2.056 | 2.059 | 2.184 | 2.327 | 2.332 | 2.367 | 2.423 | 2.391 | 2.517 | 2.634 | 2.970 | 3.026 |
| 2008 | 3.011 | 3.038 | 3.534 | 3.749 | 4.101 | 4.335 | 4.338 | 3.965 | 3.702 | 3.245 | 2.632 | 2.205 |
| 2009 | 2.073 | 1.992 | 1.873 | 1.901 | 1.969 | 2.112 | 2.115 | 2.242 | 2.222 | 2.296 | 2.409 | 2.352 |
| 2010 | 2.511 | W | W | 2.650 | 2.672 | W | W | 2.589 | 2.553 | 2.673 | W | - |
| - = No Data Reported; -- = Not Applicable; NA = Not Available; W = Withheld to avoid disclosure of individual company data. |
| Release Date: 6/1/2022 |
| Next Release Date: TBD |