|
Download Data (XLS File) |
|
||||||||
|
||||||||
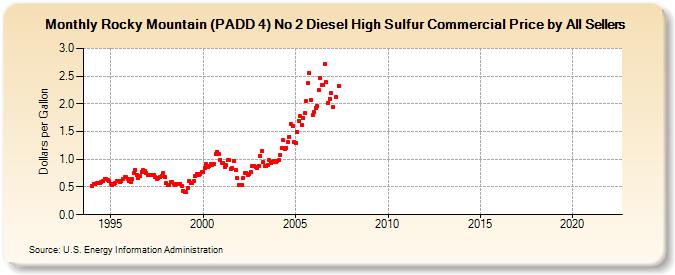
| Rocky Mountain (PADD 4) No 2 Diesel High Sulfur Commercial Price by All Sellers (Dollars per Gallon) | ||||||||
| Year | Jan | Feb | Mar | Apr | May | Jun | Jul | Aug | Sep | Oct | Nov | Dec |
|---|---|---|---|---|---|---|---|---|---|---|---|---|
| 1994 | 0.524 | 0.563 | 0.550 | 0.567 | 0.569 | 0.571 | 0.582 | 0.614 | 0.653 | 0.652 | 0.635 | 0.604 |
| 1995 | 0.554 | 0.540 | 0.547 | 0.577 | 0.612 | 0.613 | 0.591 | 0.607 | 0.646 | 0.677 | 0.672 | 0.645 |
| 1996 | 0.602 | 0.598 | 0.642 | 0.752 | 0.810 | 0.724 | 0.670 | 0.702 | 0.775 | 0.806 | 0.788 | 0.751 |
| 1997 | 0.714 | 0.713 | 0.717 | 0.724 | 0.724 | 0.680 | 0.650 | 0.665 | 0.680 | 0.705 | 0.751 | 0.687 |
| 1998 | 0.566 | 0.541 | 0.543 | 0.582 | 0.599 | 0.562 | 0.533 | 0.563 | 0.545 | 0.553 | 0.521 | 0.435 |
| 1999 | 0.408 | 0.409 | 0.482 | 0.609 | 0.570 | 0.566 | 0.604 | 0.704 | 0.737 | 0.708 | 0.737 | 0.764 |
| 2000 | 0.776 | 0.841 | 0.919 | 0.863 | 0.875 | 0.912 | 0.890 | 0.919 | 1.093 | 1.138 | 1.097 | 0.993 |
| 2001 | 0.941 | 0.929 | 0.862 | 0.889 | 0.990 | 0.988 | 0.825 | 0.835 | 0.965 | 0.809 | 0.668 | 0.543 |
| 2002 | 0.540 | 0.536 | 0.662 | 0.755 | 0.757 | 0.721 | 0.729 | 0.769 | 0.878 | 0.887 | 0.858 | 0.840 |
| 2003 | 0.880 | 1.064 | 1.143 | 0.944 | 0.871 | 0.881 | 0.904 | 0.978 | 0.934 | 0.957 | 0.972 | 0.944 |
| 2004 | 0.960 | 0.985 | 1.084 | 1.212 | 1.339 | 1.187 | 1.204 | 1.306 | 1.407 | 1.645 | 1.595 | 1.303 |
| 2005 | 1.288 | 1.493 | 1.693 | 1.778 | 1.621 | 1.751 | 1.833 | 2.047 | 2.370 | 2.550 | 2.071 | 1.803 |
| 2006 | 1.852 | 1.921 | 1.957 | 2.244 | 2.464 | 2.342 | 2.342 | 2.725 | 2.389 | 2.009 | 2.096 | 2.194 |
| 2007 | 1.934 | W | 2.123 | W | 2.321 | W | W | W | W | W | W | W |
| 2008 | W | W | - | W | - | W | W | W | W | - | W | NA |
| 2009 | - | - | W | - | - | - | - | - | - | - | - | - |
| 2010 | - | W | W | W | W | W | W | W | W | - | - | - |
| 2011 | - | - | - | - | - | - | - | - | - | - | - | - |
| 2012 | - | - | - | - | - | - | - | - | - | - | - | - |
| 2013 | - | - | - | - | - | - | - | - | - | - | - | - |
| 2014 | - | - | - | - | - | - | - | - | - | - | - | - |
| 2015 | - | - | - | - | - | - | - | - | - | - | - | - |
| 2016 | - | - | - | - | - | - | - | - | - | - | - | - |
| 2017 | - | - | - | - | - | - | - | - | - | - | - | - |
| 2018 | - | - | - | - | - | - | - | - | - | - | - | - |
| 2019 | - | - | - | - | - | - | - | - | - | - | - | - |
| 2020 | - | - | - | - | - | - | - | - | - | - | - | - |
| 2021 | - | - | - | - | - | - | - | - | - | - | - | - |
| 2022 | - | - | - | |||||||||
| - = No Data Reported; -- = Not Applicable; NA = Not Available; W = Withheld to avoid disclosure of individual company data. |
| Release Date: 6/1/2022 |
| Next Release Date: TBD |