|
Download Data (XLS File) |
|
||||||||
|
||||||||
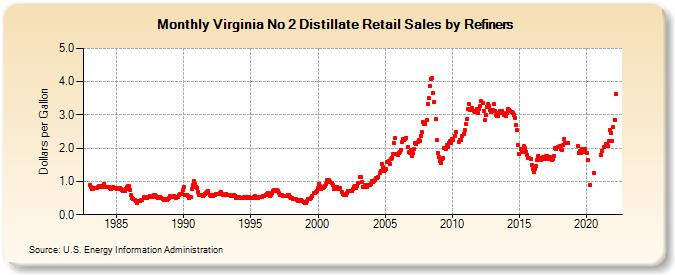
| Virginia No 2 Distillate Retail Sales by Refiners (Dollars per Gallon) | ||||||||
| Year | Jan | Feb | Mar | Apr | May | Jun | Jul | Aug | Sep | Oct | Nov | Dec |
|---|---|---|---|---|---|---|---|---|---|---|---|---|
| 1983 | 0.884 | 0.832 | 0.767 | 0.775 | 0.816 | 0.805 | 0.810 | 0.822 | 0.852 | 0.845 | 0.850 | 0.822 |
| 1984 | 0.869 | 0.933 | 0.836 | 0.827 | 0.829 | 0.837 | 0.801 | 0.782 | 0.800 | 0.821 | 0.800 | 0.794 |
| 1985 | 0.778 | 0.779 | 0.768 | 0.800 | 0.778 | 0.738 | 0.707 | 0.715 | 0.784 | 0.826 | 0.875 | 0.853 |
| 1986 | 0.748 | 0.588 | 0.513 | 0.482 | 0.454 | 0.407 | 0.348 | 0.415 | 0.419 | 0.412 | 0.430 | 0.440 |
| 1987 | 0.523 | 0.505 | 0.496 | 0.504 | 0.528 | 0.541 | 0.561 | 0.566 | 0.537 | 0.579 | 0.581 | 0.554 |
| 1988 | 0.531 | 0.497 | 0.488 | 0.519 | 0.512 | 0.478 | 0.451 | 0.463 | 0.451 | 0.441 | 0.467 | 0.517 |
| 1989 | 0.553 | 0.520 | 0.546 | 0.577 | 0.535 | 0.508 | 0.526 | 0.531 | 0.582 | 0.622 | 0.620 | 0.752 |
| 1990 | 0.838 | 0.605 | 0.596 | 0.587 | 0.559 | 0.517 | 0.544 | 0.765 | 0.892 | 1.011 | 0.920 | 0.839 |
| 1991 | 0.793 | 0.697 | 0.599 | 0.588 | 0.586 | 0.573 | 0.607 | 0.635 | 0.643 | 0.691 | 0.703 | 0.588 |
| 1992 | 0.553 | 0.578 | 0.562 | 0.586 | 0.601 | 0.632 | 0.625 | 0.622 | 0.650 | 0.670 | 0.621 | 0.601 |
| 1993 | 0.580 | 0.592 | 0.618 | 0.597 | 0.600 | 0.578 | 0.552 | 0.552 | 0.568 | 0.602 | 0.573 | 0.492 |
| 1994 | 0.516 | 0.542 | 0.505 | 0.495 | 0.499 | 0.515 | 0.526 | 0.521 | 0.510 | 0.521 | 0.525 | 0.510 |
| 1995 | 0.510 | 0.509 | 0.497 | 0.529 | 0.548 | 0.514 | 0.503 | 0.528 | 0.537 | 0.519 | 0.543 | 0.575 |
| 1996 | 0.568 | 0.595 | 0.619 | 0.665 | 0.616 | 0.553 | 0.586 | 0.640 | 0.700 | 0.745 | 0.727 | 0.735 |
| 1997 | 0.708 | 0.657 | 0.591 | 0.582 | 0.589 | 0.555 | 0.556 | 0.574 | 0.562 | 0.606 | 0.599 | 0.547 |
| 1998 | 0.507 | 0.492 | 0.465 | 0.474 | 0.466 | 0.431 | 0.420 | 0.406 | 0.454 | 0.451 | 0.414 | 0.374 |
| 1999 | 0.367 | 0.355 | 0.413 | 0.474 | 0.464 | 0.476 | 0.504 | 0.575 | 0.641 | 0.640 | 0.682 | 0.712 |
| 2000 | 0.801 | 0.933 | 0.852 | 0.785 | 0.803 | 0.829 | 0.856 | 0.913 | 1.035 | 1.028 | 1.041 | 0.969 |
| 2001 | 0.963 | 0.891 | 0.783 | 0.832 | 0.836 | 0.831 | 0.765 | 0.782 | 0.808 | 0.691 | 0.632 | 0.595 |
| 2002 | 0.582 | 0.585 | 0.661 | 0.704 | 0.710 | 0.703 | 0.727 | 0.758 | 0.837 | 0.858 | 0.792 | 0.850 |
| 2003 | 0.941 | 1.128 | 1.142 | 0.973 | 0.821 | 0.832 | 0.852 | 0.894 | 0.837 | 0.879 | 0.899 | 0.926 |
| 2004 | 1.004 | 0.985 | 1.026 | 1.043 | 1.105 | 1.106 | 1.144 | 1.241 | 1.328 | 1.538 | 1.449 | 1.321 |
| 2005 | 1.340 | 1.369 | 1.588 | 1.626 | 1.518 | 1.683 | 1.706 | 1.817 | 2.148 | 2.298 | 1.814 | 1.793 |
| 2006 | 1.861 | 1.882 | 1.957 | 2.175 | 2.272 | 2.256 | 2.272 | 2.320 | 2.027 | 1.871 | 1.866 | 1.935 |
| 2007 | 1.767 | 1.843 | 1.963 | 2.141 | 2.113 | 2.174 | 2.238 | 2.226 | 2.378 | 2.478 | 2.778 | 2.728 |
| 2008 | 2.740 | 2.851 | 3.339 | 3.508 | 3.862 | 4.070 | 4.110 | 3.653 | 3.396 | 2.871 | 2.258 | 1.856 |
| 2009 | 1.726 | 1.608 | 1.554 | 1.660 | 1.699 | 2.009 | 1.970 | 2.108 | 2.049 | 2.145 | 2.203 | 2.165 |
| 2010 | 2.288 | 2.240 | 2.373 | 2.492 | NA | NA | 2.182 | 2.237 | 2.233 | 2.370 | 2.441 | 2.557 |
| 2011 | 2.716 | 2.889 | 3.180 | 3.329 | 3.150 | 3.150 | 3.204 | 3.109 | 3.095 | 3.096 | 3.190 | 3.054 |
| 2012 | 3.174 | 3.283 | 3.410 | 3.353 | 3.130 | 2.849 | 3.012 | 3.242 | 3.331 | 3.271 | 3.133 | 3.102 |
| 2013 | 3.146 | 3.323 | 3.122 | 2.990 | 2.955 | 2.957 | 3.065 | 3.129 | 3.125 | 3.048 | 2.990 | 3.017 |
| 2014 | 2.977 | 3.069 | 3.179 | 3.155 | 3.130 | 3.093 | 3.051 | 2.995 | 2.920 | 2.690 | 2.539 | 2.093 |
| 2015 | 1.822 | 1.972 | 1.876 | 1.946 | 2.054 | 1.995 | 1.888 | 1.795 | 1.718 | 1.690 | 1.660 | 1.502 |
| 2016 | 1.378 | 1.292 | 1.385 | 1.473 | 1.653 | 1.770 | 1.691 | 1.651 | 1.675 | 1.722 | 1.687 | 1.734 |
| 2017 | 1.753 | 1.765 | 1.688 | 1.730 | 1.712 | 1.638 | 1.674 | 1.772 | 1.997 | 1.978 | 2.044 | 2.032 |
| 2018 | 2.069 | 1.964 | 1.938 | 2.084 | 2.264 | 2.149 | 2.153 | 2.152 | W | W | W | W |
| 2019 | W | W | W | W | 2.067 | 1.870 | 1.918 | 1.861 | 1.972 | 1.937 | 1.897 | 1.962 |
| 2020 | 1.855 | 1.634 | W | 0.894 | W | W | W | 1.250 | W | W | W | W |
| 2021 | W | 1.792 | 1.910 | W | 2.034 | 2.139 | 2.133 | 2.078 | 2.208 | 2.532 | 2.445 | 2.228 |
| 2022 | 2.635 | 2.851 | 3.620 | |||||||||
| - = No Data Reported; -- = Not Applicable; NA = Not Available; W = Withheld to avoid disclosure of individual company data. |
| Release Date: 6/1/2022 |
| Next Release Date: TBD |