|
Download Data (XLS File) |
|
||||||||
|
||||||||
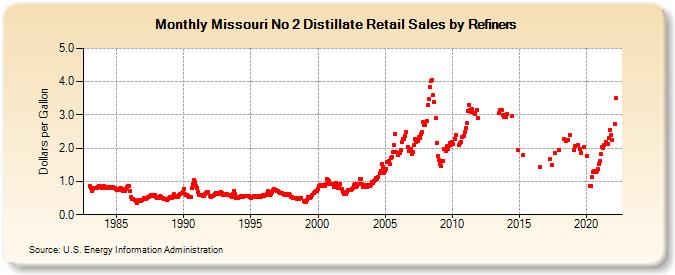
| Missouri No 2 Distillate Retail Sales by Refiners (Dollars per Gallon) | ||||||||
| Year | Jan | Feb | Mar | Apr | May | Jun | Jul | Aug | Sep | Oct | Nov | Dec |
|---|---|---|---|---|---|---|---|---|---|---|---|---|
| 1983 | 0.858 | 0.792 | 0.725 | 0.760 | 0.801 | 0.804 | 0.818 | 0.837 | 0.859 | 0.857 | 0.838 | 0.817 |
| 1984 | 0.843 | 0.867 | 0.817 | 0.807 | 0.827 | 0.847 | 0.826 | 0.803 | 0.805 | 0.821 | 0.811 | 0.787 |
| 1985 | 0.755 | 0.728 | 0.731 | 0.789 | 0.802 | 0.759 | 0.712 | 0.721 | 0.777 | 0.822 | 0.876 | 0.861 |
| 1986 | 0.716 | 0.546 | 0.469 | 0.487 | 0.452 | 0.409 | 0.346 | 0.412 | 0.428 | 0.414 | 0.426 | 0.428 |
| 1987 | 0.490 | 0.476 | 0.487 | 0.498 | 0.524 | 0.539 | 0.558 | 0.580 | 0.560 | 0.603 | 0.599 | 0.534 |
| 1988 | 0.507 | 0.493 | 0.509 | 0.559 | 0.539 | 0.505 | 0.474 | 0.476 | 0.465 | 0.450 | 0.484 | 0.510 |
| 1989 | 0.532 | 0.517 | 0.548 | 0.615 | 0.565 | 0.526 | 0.544 | 0.547 | 0.606 | 0.634 | 0.644 | 0.697 |
| 1990 | 0.758 | 0.612 | 0.607 | 0.601 | 0.569 | 0.527 | 0.539 | 0.804 | 0.909 | 1.037 | 0.977 | 0.855 |
| 1991 | 0.797 | 0.678 | 0.599 | 0.600 | 0.582 | 0.556 | 0.574 | 0.625 | 0.638 | 0.676 | 0.695 | 0.574 |
| 1992 | 0.534 | 0.564 | 0.569 | 0.595 | 0.619 | 0.646 | 0.645 | 0.632 | 0.655 | 0.680 | 0.640 | 0.578 |
| 1993 | 0.581 | 0.600 | 0.622 | 0.609 | 0.607 | 0.591 | 0.552 | 0.531 | 0.609 | 0.722 | 0.624 | 0.492 |
| 1994 | 0.488 | 0.521 | 0.542 | 0.549 | 0.536 | 0.543 | 0.562 | 0.569 | 0.560 | 0.558 | 0.555 | 0.527 |
| 1995 | 0.514 | 0.519 | 0.520 | 0.556 | 0.567 | 0.537 | 0.526 | 0.553 | 0.568 | 0.544 | 0.568 | 0.578 |
| 1996 | 0.554 | 0.587 | 0.634 | 0.708 | 0.683 | 0.590 | 0.615 | 0.691 | 0.749 | 0.770 | 0.745 | 0.714 |
| 1997 | 0.707 | 0.691 | 0.640 | 0.648 | 0.665 | 0.621 | 0.591 | 0.615 | 0.594 | 0.619 | 0.635 | 0.578 |
| 1998 | 0.525 | 0.527 | 0.511 | 0.516 | 0.512 | 0.475 | 0.479 | 0.458 | 0.491 | 0.495 | NA | 0.409 |
| 1999 | 0.396 | 0.393 | 0.449 | 0.520 | 0.514 | 0.514 | 0.543 | 0.597 | 0.661 | 0.672 | 0.706 | 0.711 |
| 2000 | 0.765 | 0.866 | 0.885 | 0.856 | 0.893 | 0.899 | 0.868 | 0.925 | 1.066 | 1.038 | 1.020 | 0.932 |
| 2001 | 0.929 | 0.915 | 0.824 | 0.865 | 0.964 | 0.928 | 0.818 | 0.884 | 0.931 | 0.782 | 0.692 | 0.610 |
| 2002 | 0.617 | 0.625 | 0.696 | 0.749 | 0.748 | 0.733 | 0.770 | 0.802 | 0.879 | 0.910 | 0.841 | 0.875 |
| 2003 | 0.931 | 1.077 | 1.075 | 0.931 | 0.819 | 0.831 | 0.847 | 0.904 | 0.837 | 0.880 | 0.878 | 0.891 |
| 2004 | 0.976 | 0.955 | 1.009 | 1.051 | 1.093 | 1.080 | 1.141 | 1.241 | 1.319 | 1.514 | 1.446 | 1.268 |
| 2005 | 1.324 | 1.378 | 1.585 | 1.626 | 1.522 | 1.690 | 1.731 | 1.884 | 2.081 | 2.435 | 1.871 | 1.781 |
| 2006 | 1.856 | 1.870 | 1.957 | 2.172 | 2.271 | 2.284 | 2.372 | 2.499 | 2.039 | 1.911 | 1.958 | 1.971 |
| 2007 | 1.822 | 1.874 | 2.084 | 2.269 | 2.196 | 2.224 | 2.323 | 2.315 | 2.441 | 2.495 | 2.787 | 2.707 |
| 2008 | 2.702 | 2.821 | 3.290 | 3.487 | 3.840 | 4.033 | 4.055 | 3.584 | 3.385 | 2.905 | 2.157 | 1.773 |
| 2009 | 1.654 | 1.512 | 1.469 | 1.608 | 1.628 | 1.989 | 1.915 | 2.058 | 1.978 | 2.078 | 2.162 | 2.105 |
| 2010 | 2.185 | 2.124 | 2.279 | 2.393 | NA | NA | 2.088 | 2.155 | 2.199 | 2.322 | 2.380 | 2.474 |
| 2011 | 2.595 | 2.767 | 3.113 | 3.311 | 3.133 | 3.097 | 3.164 | 3.046 | 3.038 | W | 3.152 | 2.896 |
| 2012 | W | W | W | W | W | W | W | W | W | W | W | W |
| 2013 | W | W | W | W | W | W | 3.067 | 3.142 | 3.133 | 2.992 | 2.941 | 2.983 |
| 2014 | 2.937 | 3.042 | W | W | W | 2.955 | W | W | W | W | W | 1.933 |
| 2015 | W | W | W | 1.786 | W | W | W | W | W | W | W | W |
| 2016 | W | W | W | W | W | W | 1.446 | W | NA | W | W | NA |
| 2017 | W | W | W | 1.662 | W | 1.501 | W | W | 1.844 | W | W | 1.943 |
| 2018 | W | NA | W | W | 2.264 | W | 2.209 | 2.239 | W | 2.389 | W | W |
| 2019 | NA | 1.957 | 2.075 | W | 2.083 | W | 1.968 | 1.864 | NA | NA | 2.042 | W |
| 2020 | 1.757 | W | W | 0.876 | 0.857 | 1.148 | 1.282 | 1.306 | 1.293 | 1.304 | 1.380 | 1.534 |
| 2021 | 1.628 | 1.825 | 2.040 | 2.001 | 2.089 | 2.199 | 2.121 | 2.117 | 2.302 | 2.561 | 2.387 | 2.243 |
| 2022 | NA | 2.726 | 3.508 | |||||||||
| - = No Data Reported; -- = Not Applicable; NA = Not Available; W = Withheld to avoid disclosure of individual company data. |
| Release Date: 6/1/2022 |
| Next Release Date: TBD |