|
Download Data (XLS File) |
|
||||||||
|
||||||||
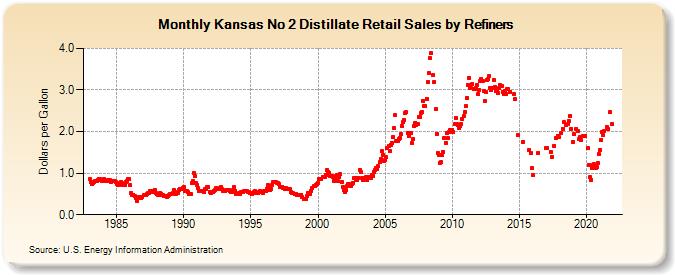
| Kansas No 2 Distillate Retail Sales by Refiners (Dollars per Gallon) | ||||||||
| Year | Jan | Feb | Mar | Apr | May | Jun | Jul | Aug | Sep | Oct | Nov | Dec |
|---|---|---|---|---|---|---|---|---|---|---|---|---|
| 1983 | 0.851 | 0.790 | 0.728 | 0.751 | 0.796 | 0.802 | 0.815 | 0.837 | 0.856 | 0.849 | 0.835 | 0.813 |
| 1984 | 0.827 | 0.856 | 0.821 | 0.809 | 0.823 | 0.842 | 0.827 | 0.797 | W | 0.814 | 0.809 | 0.793 |
| 1985 | 0.741 | 0.705 | 0.724 | 0.768 | 0.783 | 0.752 | 0.715 | 0.723 | 0.778 | 0.814 | 0.863 | 0.853 |
| 1986 | 0.710 | 0.528 | 0.472 | 0.482 | 0.446 | 0.395 | 0.340 | 0.406 | 0.427 | 0.405 | 0.412 | 0.421 |
| 1987 | 0.466 | 0.470 | 0.481 | 0.494 | 0.516 | 0.533 | 0.561 | 0.566 | 0.542 | 0.579 | 0.597 | 0.519 |
| 1988 | 0.491 | 0.464 | 0.474 | 0.525 | 0.506 | 0.476 | 0.448 | 0.461 | 0.445 | 0.434 | 0.456 | 0.483 |
| 1989 | 0.509 | 0.494 | 0.531 | 0.594 | 0.544 | 0.509 | 0.525 | 0.534 | 0.592 | 0.617 | 0.615 | 0.647 |
| 1990 | 0.670 | 0.567 | 0.581 | 0.566 | 0.542 | 0.498 | 0.509 | 0.754 | 0.810 | 1.004 | 0.933 | 0.768 |
| 1991 | 0.718 | 0.631 | 0.578 | 0.578 | 0.564 | 0.559 | 0.556 | 0.612 | 0.627 | 0.666 | 0.663 | 0.555 |
| 1992 | 0.520 | 0.548 | 0.557 | 0.578 | 0.598 | 0.633 | 0.630 | 0.618 | 0.650 | 0.663 | 0.607 | 0.568 |
| 1993 | 0.561 | 0.582 | 0.603 | 0.591 | 0.591 | 0.573 | 0.537 | 0.536 | 0.585 | 0.661 | 0.582 | 0.499 |
| 1994 | 0.493 | 0.523 | 0.508 | 0.537 | 0.536 | 0.551 | 0.564 | 0.576 | 0.569 | 0.557 | 0.547 | 0.513 |
| 1995 | 0.513 | 0.506 | 0.512 | 0.550 | 0.559 | 0.530 | 0.515 | 0.549 | 0.573 | 0.550 | 0.551 | 0.534 |
| 1996 | 0.575 | 0.574 | 0.620 | 0.703 | 0.675 | 0.590 | 0.624 | 0.722 | 0.779 | 0.794 | 0.795 | 0.767 |
| 1997 | 0.752 | 0.735 | 0.674 | 0.672 | 0.673 | 0.646 | 0.610 | 0.638 | 0.613 | 0.625 | 0.620 | 0.608 |
| 1998 | 0.551 | 0.529 | 0.513 | 0.488 | 0.501 | 0.467 | 0.472 | 0.468 | 0.482 | 0.481 | 0.427 | 0.380 |
| 1999 | 0.385 | 0.376 | 0.439 | 0.522 | 0.495 | 0.502 | 0.572 | 0.639 | 0.682 | 0.697 | 0.724 | 0.729 |
| 2000 | 0.762 | 0.855 | 0.863 | 0.851 | 0.903 | 0.916 | 0.896 | 0.955 | 1.072 | 1.038 | 1.011 | 0.925 |
| 2001 | 0.940 | 0.918 | 0.822 | 0.853 | 0.939 | 0.956 | 0.808 | 0.898 | 0.977 | 0.783 | 0.672 | 0.587 |
| 2002 | 0.550 | 0.590 | 0.688 | 0.738 | 0.742 | 0.681 | 0.747 | 0.772 | 0.877 | 0.884 | 0.823 | 0.844 |
| 2003 | 0.891 | 1.084 | 1.035 | 0.875 | 0.840 | 0.851 | 0.874 | 0.902 | 0.828 | 0.911 | 0.900 | 0.891 |
| 2004 | 0.962 | 0.926 | 1.018 | 1.077 | 1.128 | 1.093 | 1.163 | 1.263 | 1.335 | 1.525 | 1.448 | 1.290 |
| 2005 | 1.318 | 1.381 | 1.609 | 1.650 | 1.521 | 1.685 | 1.730 | 1.863 | 2.088 | 2.388 | 1.777 | 1.766 |
| 2006 | 1.817 | 1.850 | 1.933 | 2.138 | 2.219 | 2.288 | 2.441 | 2.465 | 1.973 | 1.885 | 1.966 | 1.960 |
| 2007 | 1.719 | 1.814 | 2.125 | 2.212 | 2.166 | 2.172 | 2.350 | 2.356 | 2.443 | 2.477 | 2.745 | 2.611 |
| 2008 | 2.603 | 2.788 | 3.185 | 3.397 | 3.758 | 3.881 | NA | 3.353 | 3.203 | 2.531 | 1.944 | 1.481 |
| 2009 | 1.443 | 1.250 | 1.260 | 1.429 | 1.519 | 1.851 | 1.735 | 1.957 | 1.835 | 1.986 | 2.033 | 2.005 |
| 2010 | 2.038 | 1.987 | 2.171 | 2.337 | 2.179 | 2.146 | 2.090 | 2.139 | 2.170 | 2.291 | 2.368 | 2.474 |
| 2011 | 2.609 | 2.814 | 3.129 | 3.285 | 3.057 | 3.047 | 3.141 | 3.014 | 3.013 | 3.059 | 3.125 | 2.895 |
| 2012 | 3.007 | 3.215 | 3.267 | 3.214 | 2.978 | 2.726 | 2.962 | 3.250 | 3.255 | 3.340 | 3.058 | 3.002 |
| 2013 | 3.037 | 3.241 | 3.075 | 2.968 | 2.997 | 2.937 | 3.040 | 3.118 | 3.095 | 2.958 | 2.913 | 2.964 |
| 2014 | 2.911 | 3.020 | 3.019 | W | 2.963 | W | W | 2.893 | 2.778 | W | W | 1.922 |
| 2015 | W | W | W | 1.758 | W | W | W | W | W | 1.557 | 1.474 | 1.115 |
| 2016 | 0.966 | W | W | W | W | 1.488 | W | W | W | W | W | W |
| 2017 | 1.608 | 1.595 | W | W | 1.509 | 1.394 | W | 1.664 | W | 1.855 | 1.903 | 1.879 |
| 2018 | W | 1.954 | W | 2.065 | 2.222 | W | 2.164 | 2.176 | 2.263 | 2.375 | 2.072 | W |
| 2019 | 1.751 | 1.932 | W | 2.064 | 2.008 | 1.813 | 1.870 | 1.791 | W | 1.897 | W | 1.888 |
| 2020 | W | 1.604 | 1.200 | 0.896 | 0.845 | 1.113 | 1.207 | 1.209 | 1.135 | 1.141 | 1.248 | 1.451 |
| 2021 | 1.558 | 1.798 | 1.999 | 1.917 | 2.025 | W | 2.116 | 2.068 | W | 2.459 | W | 2.185 |
| 2022 | W | W | W | |||||||||
| - = No Data Reported; -- = Not Applicable; NA = Not Available; W = Withheld to avoid disclosure of individual company data. |
| Release Date: 6/1/2022 |
| Next Release Date: TBD |