|
Download Data (XLS File) |
|
||||||||
|
||||||||
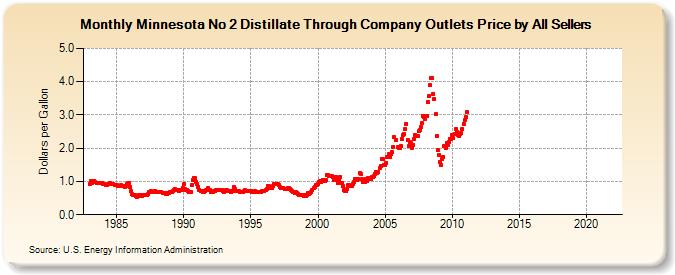
| Minnesota No 2 Distillate Through Company Outlets Price by All Sellers (Dollars per Gallon) | ||||||||
| Year | Jan | Feb | Mar | Apr | May | Jun | Jul | Aug | Sep | Oct | Nov | Dec |
|---|---|---|---|---|---|---|---|---|---|---|---|---|
| 1983 | 0.936 | 1.013 | 0.952 | 0.994 | 1.019 | 0.982 | 0.950 | NA | 0.960 | 0.966 | 0.965 | 0.966 |
| 1984 | 0.934 | 0.921 | 0.905 | 0.907 | 0.912 | 0.923 | 0.948 | 0.923 | 0.922 | 0.925 | 0.904 | 0.906 |
| 1985 | 0.879 | 0.863 | 0.867 | 0.871 | 0.880 | 0.858 | 0.857 | 0.845 | 0.851 | 0.919 | 0.950 | 0.963 |
| 1986 | 0.819 | 0.705 | 0.622 | 0.606 | 0.600 | 0.559 | 0.545 | 0.550 | 0.580 | 0.574 | 0.578 | 0.575 |
| 1987 | 0.589 | 0.593 | 0.588 | 0.598 | 0.614 | 0.678 | 0.688 | 0.703 | 0.691 | 0.694 | 0.711 | 0.690 |
| 1988 | 0.670 | 0.697 | 0.689 | 0.670 | 0.683 | 0.666 | 0.648 | 0.655 | 0.631 | 0.633 | 0.638 | 0.658 |
| 1989 | 0.668 | 0.683 | 0.720 | 0.751 | 0.758 | 0.743 | 0.756 | 0.749 | 0.712 | 0.736 | 0.740 | 0.806 |
| 1990 | 0.913 | 0.766 | 0.729 | 0.738 | 0.713 | 0.687 | 0.685 | 0.892 | 1.047 | 1.109 | 1.095 | 0.994 |
| 1991 | 0.919 | 0.839 | 0.747 | 0.719 | 0.710 | 0.679 | 0.678 | 0.708 | 0.738 | 0.756 | 0.798 | 0.740 |
| 1992 | 0.686 | 0.677 | 0.683 | 0.702 | 0.717 | 0.730 | 0.737 | 0.744 | 0.752 | 0.756 | 0.754 | 0.723 |
| 1993 | 0.694 | 0.698 | 0.730 | 0.746 | 0.725 | 0.700 | 0.692 | 0.703 | 0.698 | 0.848 | 0.763 | 0.714 |
| 1994 | 0.702 | 0.708 | 0.697 | 0.695 | 0.693 | 0.686 | 0.704 | 0.734 | 0.721 | 0.720 | 0.719 | 0.713 |
| 1995 | 0.723 | 0.689 | 0.683 | 0.695 | 0.702 | 0.691 | 0.687 | 0.692 | 0.694 | 0.697 | 0.701 | 0.709 |
| 1996 | 0.711 | 0.729 | 0.765 | 0.876 | 0.863 | 0.812 | 0.799 | 0.817 | 0.863 | 0.913 | 0.935 | 0.932 |
| 1997 | 0.915 | 0.893 | 0.839 | 0.811 | 0.813 | 0.804 | 0.779 | 0.780 | 0.775 | 0.789 | 0.794 | 0.773 |
| 1998 | 0.738 | 0.700 | 0.672 | 0.667 | 0.668 | 0.646 | 0.616 | 0.600 | 0.606 | 0.605 | 0.594 | 0.577 |
| 1999 | 0.579 | 0.564 | 0.591 | 0.639 | 0.637 | 0.642 | 0.679 | 0.742 | 0.803 | 0.842 | 0.882 | 0.896 |
| 2000 | 0.922 | 0.997 | 0.999 | 0.985 | 1.039 | 1.037 | 1.016 | 1.043 | 1.197 | 1.192 | 1.174 | 1.162 |
| 2001 | 1.164 | 1.125 | 1.035 | 1.042 | 1.147 | 1.114 | 0.967 | 1.029 | 1.128 | 0.956 | 0.851 | 0.749 |
| 2002 | 0.722 | 0.705 | 0.786 | 0.885 | 0.879 | 0.859 | 0.874 | 0.917 | 0.980 | 1.073 | 1.044 | 1.030 |
| 2003 | 1.059 | 1.245 | 1.224 | 1.065 | 0.990 | 0.982 | 0.987 | 1.068 | 1.019 | 1.105 | 1.076 | 1.070 |
| 2004 | 1.123 | 1.128 | 1.170 | 1.232 | 1.272 | 1.262 | 1.291 | 1.395 | 1.477 | 1.676 | 1.670 | 1.498 |
| 2005 | 1.482 | 1.553 | 1.738 | 1.819 | 1.721 | 1.816 | 1.884 | 2.049 | 2.327 | NA | 2.235 | 2.026 |
| 2006 | 1.998 | 2.011 | 2.077 | 2.272 | 2.392 | 2.417 | 2.572 | 2.737 | 2.249 | 2.064 | 2.173 | 2.163 |
| 2007 | 2.015 | 2.100 | 2.278 | 2.400 | 2.362 | 2.377 | 2.504 | 2.548 | 2.631 | 2.753 | 2.969 | 2.943 |
| 2008 | 2.872 | 2.967 | 3.381 | 3.555 | 3.905 | 4.103 | 4.107 | 3.643 | 3.485 | 3.017 | 2.364 | 1.931 |
| 2009 | 1.809 | 1.599 | 1.505 | 1.664 | 1.736 | 2.072 | 2.007 | 2.163 | 2.097 | 2.192 | 2.272 | 2.291 |
| 2010 | 2.399 | 2.302 | 2.414 | 2.563 | 2.494 | 2.385 | 2.357 | 2.423 | 2.449 | 2.581 | 2.738 | 2.837 |
| 2011 | 2.942 | 3.076 | - | - | - | - | - | - | - | - | - | - |
| 2012 | - | - | - | - | - | - | - | - | - | - | - | - |
| 2013 | - | - | - | - | - | - | - | - | - | - | - | - |
| 2014 | - | - | - | - | - | - | - | - | - | - | - | - |
| 2015 | - | - | - | - | - | - | - | - | - | - | - | - |
| 2016 | - | - | - | - | - | - | - | - | - | - | - | - |
| 2017 | - | - | - | - | - | - | - | - | - | - | - | - |
| 2018 | - | - | - | - | - | - | - | - | - | - | - | - |
| 2019 | - | - | - | - | - | - | - | - | - | - | - | - |
| 2020 | - | - | - | - | - | - | - | - | - | - | - | - |
| 2021 | - | - | - | - | - | - | - | - | - | - | - | - |
| 2022 | - | - | - | |||||||||
| - = No Data Reported; -- = Not Applicable; NA = Not Available; W = Withheld to avoid disclosure of individual company data. |
| Release Date: 6/1/2022 |
| Next Release Date: TBD |