|
Download Data (XLS File) |
|
||||||||
|
||||||||
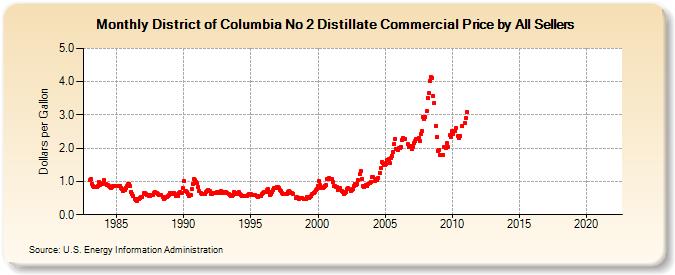
| District of Columbia No 2 Distillate Commercial Price by All Sellers (Dollars per Gallon) | ||||||||
| Year | Jan | Feb | Mar | Apr | May | Jun | Jul | Aug | Sep | Oct | Nov | Dec |
|---|---|---|---|---|---|---|---|---|---|---|---|---|
| 1983 | 1.035 | 1.073 | 0.929 | 0.860 | 0.844 | 0.847 | 0.842 | 0.870 | 0.992 | 0.895 | 0.937 | 0.933 |
| 1984 | 0.945 | 1.033 | 0.937 | 0.897 | 0.885 | 0.866 | 0.838 | 0.816 | 0.839 | 0.862 | 0.874 | 0.871 |
| 1985 | 0.849 | 0.870 | 0.855 | 0.874 | 0.812 | 0.759 | 0.720 | 0.735 | 0.807 | 0.850 | 0.914 | 0.927 |
| 1986 | 0.870 | 0.691 | 0.611 | 0.565 | 0.485 | 0.445 | 0.415 | 0.465 | 0.479 | 0.491 | 0.519 | 0.536 |
| 1987 | 0.641 | 0.652 | 0.612 | 0.580 | 0.579 | 0.574 | 0.575 | 0.595 | 0.592 | 0.660 | 0.687 | 0.664 |
| 1988 | 0.646 | 0.620 | 0.590 | 0.595 | 0.590 | 0.522 | 0.479 | 0.501 | 0.540 | 0.541 | 0.558 | 0.594 |
| 1989 | 0.640 | 0.621 | 0.646 | 0.662 | 0.608 | 0.566 | 0.592 | 0.569 | 0.640 | 0.671 | 0.657 | 0.793 |
| 1990 | 1.005 | 0.722 | 0.699 | 0.670 | 0.613 | 0.557 | 0.586 | 0.780 | 0.924 | 1.070 | 1.040 | 0.992 |
| 1991 | 0.947 | 0.826 | 0.704 | 0.649 | 0.608 | 0.610 | 0.631 | 0.624 | 0.690 | 0.713 | 0.754 | 0.709 |
| 1992 | 0.632 | 0.637 | 0.659 | 0.657 | 0.650 | 0.664 | 0.670 | 0.672 | 0.665 | 0.698 | 0.694 | 0.666 |
| 1993 | 0.673 | 0.670 | 0.671 | 0.649 | 0.628 | 0.603 | 0.572 | 0.570 | 0.583 | 0.685 | 0.654 | 0.633 |
| 1994 | 0.667 | 0.673 | 0.625 | 0.588 | 0.560 | 0.563 | 0.570 | 0.573 | 0.563 | 0.585 | 0.614 | 0.614 |
| 1995 | 0.613 | 0.604 | 0.602 | 0.599 | 0.587 | 0.551 | 0.534 | 0.557 | 0.563 | 0.562 | 0.610 | 0.653 |
| 1996 | 0.677 | 0.675 | 0.732 | 0.762 | 0.672 | 0.590 | 0.618 | 0.670 | 0.737 | 0.810 | 0.816 | 0.838 |
| 1997 | 0.821 | 0.806 | 0.735 | 0.705 | 0.660 | 0.626 | 0.617 | 0.626 | 0.618 | 0.683 | 0.701 | 0.689 |
| 1998 | 0.644 | 0.638 | 0.634 | NA | 0.511 | 0.520 | 0.495 | 0.481 | 0.502 | 0.511 | 0.495 | 0.481 |
| 1999 | 0.484 | 0.458 | 0.525 | 0.531 | 0.514 | 0.531 | 0.560 | 0.611 | 0.661 | 0.689 | 0.729 | 0.778 |
| 2000 | 0.856 | 1.004 | 0.883 | 0.793 | 0.807 | 0.827 | 0.873 | 0.893 | 1.060 | 1.061 | 1.108 | 1.067 |
| 2001 | 1.081 | 0.969 | 0.854 | 0.858 | 0.829 | 0.827 | 0.752 | 0.773 | 0.801 | 0.712 | 0.673 | 0.636 |
| 2002 | 0.665 | 0.670 | 0.784 | 0.790 | 0.758 | 0.700 | 0.737 | 0.785 | 0.878 | 0.916 | 0.888 | 0.934 |
| 2003 | 1.029 | 1.214 | 1.300 | 1.080 | 0.858 | 0.842 | 0.865 | 0.901 | 0.864 | 0.925 | 0.951 | 0.989 |
| 2004 | 1.121 | 1.132 | NA | 1.020 | 1.077 | 1.051 | 1.114 | 1.255 | 1.392 | 1.586 | 1.543 | 1.497 |
| 2005 | 1.506 | 1.522 | 1.645 | 1.667 | 1.562 | 1.698 | 1.778 | 1.877 | 2.127 | 2.280 | 1.961 | 1.938 |
| 2006 | 2.005 | 1.995 | 2.047 | 2.248 | 2.317 | 2.280 | 2.291 | NA | 2.115 | 2.024 | 2.042 | 2.051 |
| 2007 | 1.962 | 2.045 | 2.145 | 2.204 | 2.268 | 2.269 | 2.315 | 2.228 | 2.436 | 2.522 | 2.934 | 2.880 |
| 2008 | 2.937 | 3.107 | 3.505 | 3.651 | 4.027 | 4.148 | 4.107 | 3.573 | 3.352 | 2.676 | 2.347 | 1.928 |
| 2009 | 1.954 | 1.794 | 1.802 | 1.792 | 1.809 | 2.049 | 1.999 | 2.148 | 2.040 | NA | 2.382 | 2.328 |
| 2010 | 2.506 | 2.440 | 2.505 | 2.603 | NA | 2.359 | 2.304 | 2.366 | NA | 2.656 | NA | 2.761 |
| 2011 | 2.917 | 3.098 | - | - | - | - | - | - | - | - | - | - |
| 2012 | - | - | - | - | - | - | - | - | - | - | - | - |
| 2013 | - | - | - | - | - | - | - | - | - | - | - | - |
| 2014 | - | - | - | - | - | - | - | - | - | - | - | - |
| 2015 | - | - | - | - | - | - | - | - | - | - | - | - |
| 2016 | - | - | - | - | - | - | - | - | - | - | - | - |
| 2017 | - | - | - | - | - | - | - | - | - | - | - | - |
| 2018 | - | - | - | - | - | - | - | - | - | - | - | - |
| 2019 | - | - | - | - | - | - | - | - | - | - | - | - |
| 2020 | - | - | - | - | - | - | - | - | - | - | - | - |
| 2021 | - | - | - | - | - | - | - | - | - | - | - | - |
| 2022 | - | - | - | |||||||||
| - = No Data Reported; -- = Not Applicable; NA = Not Available; W = Withheld to avoid disclosure of individual company data. |
| Release Date: 6/1/2022 |
| Next Release Date: TBD |