|
Download Data (XLS File) |
|
||||||||
|
||||||||
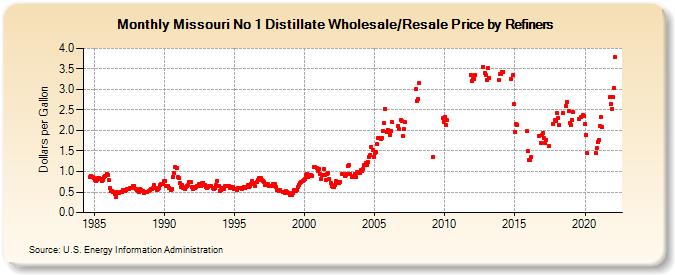
| Missouri No 1 Distillate Wholesale/Resale Price by Refiners (Dollars per Gallon) | ||||||||
| Year | Jan | Feb | Mar | Apr | May | Jun | Jul | Aug | Sep | Oct | Nov | Dec |
|---|---|---|---|---|---|---|---|---|---|---|---|---|
| 1984 | 0.864 | 0.879 | 0.869 | 0.846 | ||||||||
| 1985 | 0.790 | 0.766 | 0.783 | 0.849 | 0.847 | 0.814 | 0.778 | 0.801 | 0.865 | 0.894 | 0.949 | 0.923 |
| 1986 | 0.782 | 0.589 | 0.528 | 0.532 | 0.511 | 0.447 | 0.390 | 0.493 | 0.485 | 0.483 | 0.497 | 0.503 |
| 1987 | 0.561 | 0.526 | 0.521 | 0.539 | 0.572 | 0.585 | 0.607 | 0.605 | 0.588 | 0.659 | 0.649 | 0.563 |
| 1988 | 0.543 | 0.516 | 0.511 | 0.569 | 0.551 | 0.515 | 0.487 | 0.507 | 0.493 | 0.490 | 0.529 | 0.548 |
| 1989 | 0.579 | 0.563 | 0.589 | 0.665 | 0.599 | 0.559 | 0.581 | 0.597 | 0.665 | 0.684 | 0.692 | 0.766 |
| 1990 | 0.771 | 0.647 | 0.655 | 0.643 | 0.602 | 0.554 | 0.579 | 0.863 | 0.964 | 1.115 | 1.080 | 0.859 |
| 1991 | 0.831 | 0.714 | 0.627 | 0.664 | 0.604 | 0.569 | 0.616 | 0.654 | 0.675 | 0.736 | 0.741 | 0.611 |
| 1992 | 0.572 | 0.611 | 0.609 | 0.626 | 0.650 | 0.687 | 0.656 | 0.659 | 0.711 | 0.729 | 0.661 | 0.612 |
| 1993 | 0.605 | 0.633 | 0.653 | 0.639 | 0.637 | 0.608 | 0.576 | 0.595 | 0.660 | 0.772 | 0.658 | 0.534 |
| 1994 | 0.561 | 0.588 | 0.607 | 0.582 | 0.650 | W | 0.637 | 0.640 | 0.590 | 0.631 | 0.623 | 0.586 |
| 1995 | 0.578 | 0.565 | 0.559 | 0.593 | 0.606 | 0.594 | 0.577 | 0.609 | 0.627 | 0.604 | 0.634 | 0.660 |
| 1996 | 0.632 | 0.643 | 0.694 | 0.777 | 0.720 | 0.650 | W | 0.737 | 0.802 | 0.852 | 0.834 | 0.790 |
| 1997 | 0.777 | 0.756 | 0.681 | 0.669 | 0.707 | 0.639 | W | 0.655 | 0.639 | 0.689 | 0.692 | 0.617 |
| 1998 | 0.555 | 0.555 | 0.527 | 0.553 | W | 0.510 | 0.500 | 0.475 | 0.522 | 0.510 | 0.479 | 0.425 |
| 1999 | 0.445 | 0.426 | 0.476 | 0.539 | 0.528 | 0.545 | 0.622 | 0.675 | 0.732 | 0.740 | 0.778 | 0.787 |
| 2000 | 0.823 | 0.915 | 0.934 | 0.865 | 0.902 | 0.923 | 0.902 | W | 1.111 | 1.102 | 1.094 | 1.021 |
| 2001 | 1.056 | 0.934 | 0.827 | 0.904 | 1.051 | 0.911 | 0.799 | 0.948 | 0.965 | 0.818 | 0.725 | 0.642 |
| 2002 | 0.625 | 0.615 | 0.670 | 0.765 | 0.746 | 0.716 | 0.752 | W | 0.930 | 0.941 | 0.901 | 0.917 |
| 2003 | 0.942 | 1.128 | 1.162 | 0.938 | 0.860 | 0.867 | 0.881 | 0.935 | 0.858 | 0.993 | 0.963 | 0.967 |
| 2004 | 1.026 | 1.009 | 1.058 | 1.158 | 1.204 | 1.147 | 1.230 | 1.343 | 1.412 | 1.609 | 1.535 | 1.362 |
| 2005 | 1.444 | 1.467 | 1.661 | 1.824 | NA | 1.802 | 1.825 | 1.998 | 2.194 | 2.534 | 1.960 | 2.021 |
| 2006 | 1.985 | 1.891 | 1.989 | 2.195 | W | W | W | W | 2.098 | 2.027 | 2.258 | 2.238 |
| 2007 | 1.871 | 2.028 | 2.200 | W | W | - | - | - | W | W | W | 3.002 |
| 2008 | 2.713 | 2.755 | 3.153 | W | - | W | W | W | W | W | W | W |
| 2009 | W | W | 1.358 | W | - | W | W | W | W | W | 2.293 | 2.201 |
| 2010 | 2.324 | 2.136 | 2.245 | - | - | - | - | - | - | W | W | W |
| 2011 | W | W | W | W | - | - | - | - | W | W | 3.359 | 3.210 |
| 2012 | 3.245 | 3.266 | 3.341 | - | - | - | - | - | - | 3.554 | 3.405 | 3.341 |
| 2013 | 3.239 | 3.513 | 3.273 | W | - | - | - | - | - | W | 3.224 | 3.370 |
| 2014 | 3.375 | 3.417 | 3.436 | - | - | - | - | W | - | 3.254 | 3.344 | 2.643 |
| 2015 | 1.975 | 2.147 | 2.144 | W | - | - | - | W | W | W | 1.987 | 1.490 |
| 2016 | 1.278 | 1.273 | 1.349 | W | - | - | - | - | W | 1.876 | 1.701 | 1.883 |
| 2017 | 1.944 | 1.810 | 1.695 | 1.776 | W | 1.620 | W | - | W | 2.149 | 2.244 | 2.228 |
| 2018 | 2.419 | 2.299 | 2.128 | W | W | 2.437 | W | W | 2.593 | 2.700 | 2.469 | 2.192 |
| 2019 | 2.130 | 2.263 | 2.454 | W | W | W | W | 2.287 | W | 2.322 | 2.381 | 2.354 |
| 2020 | 2.154 | 1.887 | 1.446 | W | W | W | W | W | W | 1.454 | 1.567 | 1.710 |
| 2021 | 1.778 | 2.100 | 2.326 | 2.079 | W | W | W | W | W | 2.805 | 2.641 | 2.532 |
| 2022 | 2.815 | 3.036 | 3.783 | |||||||||
| - = No Data Reported; -- = Not Applicable; NA = Not Available; W = Withheld to avoid disclosure of individual company data. |
| Release Date: 6/1/2022 |
| Next Release Date: TBD |