|
Download Data (XLS File) |
|
||||||||
|
||||||||
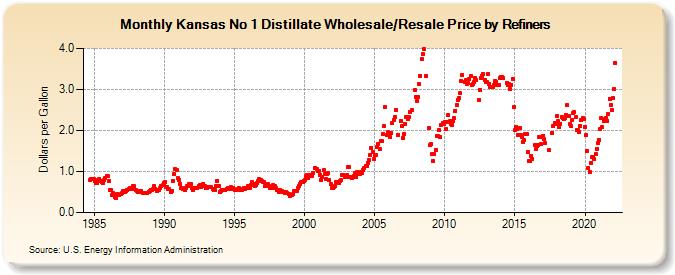
| Kansas No 1 Distillate Wholesale/Resale Price by Refiners (Dollars per Gallon) | ||||||||
| Year | Jan | Feb | Mar | Apr | May | Jun | Jul | Aug | Sep | Oct | Nov | Dec |
|---|---|---|---|---|---|---|---|---|---|---|---|---|
| 1984 | 0.798 | 0.825 | 0.822 | 0.811 | ||||||||
| 1985 | 0.757 | 0.723 | 0.723 | 0.805 | 0.825 | 0.779 | 0.735 | 0.730 | 0.797 | 0.853 | 0.896 | 0.883 |
| 1986 | 0.776 | 0.544 | 0.539 | 0.428 | 0.474 | 0.382 | 0.345 | 0.446 | 0.428 | 0.439 | 0.455 | 0.465 |
| 1987 | 0.523 | 0.510 | 0.509 | 0.516 | 0.543 | 0.566 | 0.587 | 0.565 | 0.573 | 0.639 | 0.637 | 0.561 |
| 1988 | 0.534 | 0.499 | 0.503 | 0.522 | 0.531 | 0.488 | 0.467 | 0.467 | 0.477 | 0.481 | 0.511 | 0.528 |
| 1989 | 0.553 | 0.538 | 0.571 | 0.644 | 0.574 | 0.531 | 0.545 | 0.559 | 0.603 | 0.655 | 0.662 | 0.729 |
| 1990 | 0.745 | 0.623 | 0.627 | 0.586 | 0.565 | 0.504 | 0.532 | 0.779 | 0.935 | 1.050 | 1.037 | 0.834 |
| 1991 | 0.801 | 0.693 | 0.592 | 0.593 | 0.565 | 0.538 | 0.600 | 0.639 | 0.655 | 0.696 | 0.701 | 0.594 |
| 1992 | 0.550 | 0.587 | 0.587 | 0.605 | 0.610 | 0.650 | 0.662 | 0.634 | 0.677 | 0.708 | 0.640 | 0.594 |
| 1993 | 0.595 | 0.618 | 0.628 | 0.613 | 0.614 | 0.583 | 0.548 | 0.544 | 0.640 | 0.772 | 0.659 | 0.513 |
| 1994 | 0.534 | 0.561 | 0.561 | 0.540 | 0.553 | 0.563 | 0.597 | 0.597 | 0.577 | 0.613 | 0.597 | 0.568 |
| 1995 | 0.556 | 0.548 | 0.550 | 0.569 | 0.590 | 0.557 | 0.549 | 0.583 | 0.601 | 0.579 | 0.605 | 0.638 |
| 1996 | 0.602 | 0.605 | 0.666 | 0.741 | 0.694 | 0.639 | 0.674 | 0.709 | 0.771 | 0.818 | 0.796 | 0.772 |
| 1997 | 0.743 | 0.737 | 0.649 | 0.685 | 0.693 | 0.648 | 0.607 | 0.630 | 0.595 | 0.678 | 0.653 | 0.588 |
| 1998 | 0.551 | 0.545 | 0.501 | 0.544 | 0.532 | 0.511 | NA | 0.486 | 0.498 | 0.475 | 0.448 | 0.414 |
| 1999 | 0.423 | 0.427 | 0.461 | 0.527 | 0.515 | 0.518 | 0.597 | 0.650 | 0.703 | 0.734 | 0.755 | 0.768 |
| 2000 | 0.797 | 0.889 | 0.906 | 0.851 | 0.918 | 0.897 | 0.899 | 0.970 | NA | 1.097 | 1.069 | 1.006 |
| 2001 | 1.014 | 0.913 | 0.805 | 0.877 | 1.032 | 0.935 | 0.821 | 0.949 | 0.953 | 0.782 | 0.689 | 0.604 |
| 2002 | 0.595 | 0.611 | 0.649 | 0.752 | 0.736 | 0.719 | 0.772 | 0.799 | 0.908 | 0.920 | 0.870 | 0.868 |
| 2003 | 0.915 | 1.098 | 1.122 | 0.869 | 0.846 | 0.876 | 0.886 | 0.967 | 0.868 | 0.997 | 0.930 | 0.938 |
| 2004 | 0.998 | 0.969 | 1.041 | 1.088 | 1.145 | 1.123 | 1.214 | 1.288 | 1.405 | 1.579 | 1.472 | 1.306 |
| 2005 | 1.410 | 1.410 | 1.593 | 1.670 | 1.538 | 1.744 | 1.747 | 1.922 | 2.102 | 2.560 | 1.879 | 1.958 |
| 2006 | 1.903 | 1.837 | 1.940 | 2.193 | 2.255 | 2.340 | 2.499 | NA | 1.892 | W | 2.227 | 2.101 |
| 2007 | 1.824 | 1.917 | 2.148 | 2.328 | 2.289 | 2.317 | 2.458 | W | 2.489 | W | 2.981 | 2.826 |
| 2008 | 2.724 | 2.820 | 3.130 | 3.335 | 3.742 | 3.857 | 3.975 | W | 3.334 | NA | 2.053 | 1.647 |
| 2009 | 1.661 | 1.418 | 1.259 | 1.421 | 1.535 | 1.874 | 1.854 | 2.000 | 1.847 | 2.142 | 2.182 | 2.153 |
| 2010 | 2.212 | 2.048 | 2.204 | 2.375 | 2.220 | 2.162 | 2.131 | 2.230 | 2.295 | 2.486 | 2.621 | 2.741 |
| 2011 | 2.797 | 2.905 | 3.203 | 3.356 | W | 3.188 | 3.229 | 3.139 | 3.162 | 3.244 | 3.331 | 3.120 |
| 2012 | 3.142 | 3.193 | 3.287 | 3.234 | W | 2.751 | 2.992 | 3.286 | 3.335 | 3.371 | 3.230 | 3.190 |
| 2013 | 3.187 | 3.378 | 3.140 | 3.057 | W | 3.048 | 3.106 | 3.209 | 3.179 | 3.097 | 3.098 | 3.282 |
| 2014 | 3.311 | 3.309 | 3.270 | W | NA | 3.167 | 3.111 | 3.127 | 3.003 | 3.118 | 3.266 | 2.577 |
| 2015 | 2.009 | 2.078 | 2.024 | 1.887 | 2.060 | 1.885 | 1.845 | 1.714 | 1.761 | 1.907 | 1.918 | 1.477 |
| 2016 | 1.254 | 1.264 | 1.387 | 1.313 | W | 1.635 | 1.547 | 1.610 | 1.645 | 1.842 | 1.664 | 1.829 |
| 2017 | 1.872 | 1.782 | 1.696 | W | W | 1.519 | W | W | 1.940 | 2.103 | 2.193 | 2.158 |
| 2018 | 2.362 | 2.222 | 2.075 | 2.159 | 2.336 | 2.303 | 2.272 | 2.301 | 2.382 | 2.616 | 2.363 | 2.150 |
| 2019 | 2.097 | 2.264 | 2.420 | 2.446 | 2.326 | 2.016 | 2.018 | 1.964 | 2.106 | 2.261 | 2.305 | 2.281 |
| 2020 | 2.096 | 1.882 | 1.489 | 1.091 | 0.997 | 1.214 | 1.343 | 1.362 | 1.304 | 1.428 | 1.559 | 1.687 |
| 2021 | 1.774 | 2.032 | 2.301 | 2.080 | 2.238 | 2.282 | 2.301 | 2.243 | 2.403 | 2.768 | 2.615 | 2.508 |
| 2022 | 2.785 | 3.013 | 3.649 | |||||||||
| - = No Data Reported; -- = Not Applicable; NA = Not Available; W = Withheld to avoid disclosure of individual company data. |
| Release Date: 6/1/2022 |
| Next Release Date: TBD |