|
Download Data (XLS File) |
|
||||||||||||
|
||||||||||||
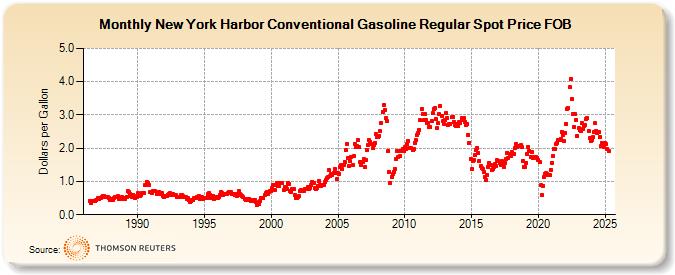
| New York Harbor Conventional Gasoline Regular Spot Price FOB (Dollars per Gallon) | ||||||||||||
| Year | Jan | Feb | Mar | Apr | May | Jun | Jul | Aug | Sep | Oct | Nov | Dec |
|---|---|---|---|---|---|---|---|---|---|---|---|---|
| 1986 | 0.420 | 0.340 | 0.426 | 0.420 | 0.410 | 0.411 | 0.434 | |||||
| 1987 | 0.489 | 0.474 | 0.509 | 0.504 | 0.542 | 0.557 | 0.556 | 0.523 | 0.518 | 0.541 | 0.516 | 0.454 |
| 1988 | 0.449 | 0.461 | 0.452 | 0.507 | 0.522 | 0.518 | 0.554 | 0.483 | 0.466 | 0.511 | 0.521 | 0.472 |
| 1989 | 0.501 | 0.483 | 0.547 | 0.700 | 0.679 | 0.637 | 0.563 | 0.527 | 0.593 | 0.556 | 0.509 | 0.541 |
| 1990 | 0.639 | 0.593 | 0.556 | 0.600 | 0.643 | 0.646 | 0.653 | 0.897 | 0.997 | 0.957 | 0.879 | 0.679 |
| 1991 | 0.688 | 0.659 | 0.723 | 0.720 | 0.701 | 0.635 | 0.652 | 0.697 | 0.621 | 0.645 | 0.649 | 0.555 |
| 1992 | 0.530 | 0.553 | 0.571 | 0.598 | 0.634 | 0.645 | 0.600 | 0.621 | 0.618 | 0.605 | 0.582 | 0.533 |
| 1993 | 0.527 | 0.523 | 0.540 | 0.594 | 0.594 | 0.548 | 0.519 | 0.532 | 0.486 | 0.503 | 0.444 | 0.376 |
| 1994 | 0.422 | 0.436 | 0.441 | 0.490 | 0.505 | 0.528 | 0.545 | 0.555 | 0.464 | 0.510 | 0.520 | 0.468 |
| 1995 | 0.511 | 0.511 | 0.504 | 0.610 | 0.648 | 0.596 | 0.511 | 0.533 | 0.561 | 0.487 | 0.505 | 0.534 |
| 1996 | 0.506 | 0.533 | 0.585 | 0.691 | 0.649 | 0.580 | 0.616 | 0.609 | 0.624 | 0.655 | 0.691 | 0.687 |
| 1997 | 0.674 | 0.624 | 0.613 | 0.587 | 0.621 | 0.551 | 0.587 | 0.705 | 0.623 | 0.584 | 0.557 | 0.518 |
| 1998 | 0.478 | 0.449 | 0.447 | 0.470 | 0.482 | 0.439 | 0.423 | 0.403 | 0.429 | 0.435 | 0.372 | 0.307 |
| 1999 | 0.343 | 0.317 | 0.423 | 0.501 | 0.492 | 0.489 | 0.583 | 0.639 | 0.688 | 0.627 | 0.696 | 0.703 |
| 2000 | 0.705 | 0.816 | 0.889 | 0.729 | 0.888 | 0.963 | 0.859 | 0.872 | 0.961 | 0.948 | 0.944 | 0.737 |
| 2001 | 0.829 | 0.826 | 0.785 | 0.947 | 0.927 | 0.720 | 0.683 | 0.776 | 0.761 | 0.598 | 0.517 | 0.517 |
| 2002 | 0.544 | 0.553 | 0.698 | 0.744 | 0.703 | 0.717 | 0.766 | 0.769 | 0.778 | 0.826 | 0.766 | 0.808 |
| 2003 | 0.879 | 0.996 | 0.955 | 0.799 | 0.760 | 0.808 | 0.873 | 1.007 | 0.903 | 0.875 | 0.882 | 0.885 |
| 2004 | 0.998 | 1.047 | 1.091 | 1.119 | 1.344 | 1.153 | 1.225 | 1.206 | 1.261 | 1.377 | 1.267 | 1.068 |
| 2005 | 1.241 | 1.224 | 1.439 | 1.480 | 1.371 | 1.509 | 1.591 | 1.937 | 2.133 | 1.709 | 1.470 | 1.600 |
| 2006 | 1.735 | 1.499 | 1.765 | 2.135 | 2.042 | 2.065 | 2.237 | 2.038 | 1.583 | 1.506 | 1.588 | 1.670 |
| 2007 | 1.432 | 1.640 | 1.938 | 2.105 | 2.245 | 2.186 | 2.137 | 2.004 | 2.102 | 2.169 | 2.424 | 2.330 |
| 2008 | 2.334 | 2.381 | 2.504 | 2.762 | 3.098 | 3.292 | 3.148 | 2.897 | 2.805 | 1.920 | 1.283 | 0.956 |
| 2009 | 1.146 | 1.216 | 1.288 | 1.379 | 1.689 | 1.906 | 1.750 | 1.930 | 1.779 | 1.924 | 1.983 | 1.919 |
| 2010 | 2.040 | 1.963 | 2.140 | 2.227 | 2.019 | 2.014 | 1.995 | 1.943 | 1.969 | 2.164 | 2.244 | 2.389 |
| 2011 | 2.448 | 2.558 | 2.838 | 3.178 | 3.024 | 2.835 | 3.021 | 2.835 | 2.768 | 2.772 | 2.629 | 2.634 |
| 2012 | 2.822 | 3.044 | 3.167 | 3.206 | 2.877 | 2.602 | 2.747 | 3.022 | 3.270 | 2.975 | 2.817 | 2.727 |
| 2013 | 2.852 | 3.053 | 2.914 | 2.706 | 2.742 | 2.740 | 2.924 | 2.933 | 2.797 | 2.685 | 2.673 | 2.736 |
| 2014 | 2.672 | 2.795 | 2.753 | 2.896 | 2.862 | 2.896 | 2.802 | 2.705 | 2.721 | 2.398 | 2.165 | 1.683 |
| 2015 | 1.364 | 1.607 | 1.644 | 1.793 | 1.938 | 2.005 | 1.860 | 1.620 | 1.460 | 1.397 | 1.377 | 1.276 |
| 2016 | 1.121 | 1.058 | 1.201 | 1.448 | 1.566 | 1.506 | 1.354 | 1.379 | 1.438 | 1.522 | 1.462 | 1.634 |
| 2017 | 1.620 | 1.547 | 1.492 | 1.611 | 1.540 | 1.445 | 1.562 | 1.688 | 1.867 | 1.715 | 1.830 | 1.757 |
| 2018 | 1.899 | 1.817 | 1.834 | 1.995 | 2.129 | 2.030 | 2.074 | 2.077 | 2.093 | 2.028 | 1.625 | 1.449 |
| 2019 | 1.425 | 1.568 | 1.812 | 2.042 | 1.916 | 1.740 | 1.890 | 1.694 | 1.726 | 1.728 | 1.724 | 1.713 |
| 2020 | 1.658 | 1.580 | 0.891 | 0.593 | 0.876 | 1.121 | 1.220 | 1.248 | 1.227 | 1.201 | 1.190 | 1.359 |
| 2021 | 1.563 | 1.761 | 1.986 | 1.988 | 2.116 | 2.167 | 2.257 | 2.235 | 2.284 | 2.500 | 2.390 | 2.203 |
| 2022 | 2.449 | 2.739 | 3.184 | 3.193 | 3.828 | 4.082 | 3.484 | 3.027 | 2.642 | 3.013 | 2.852 | 2.366 |
| 2023 | 2.593 | 2.532 | 2.515 | 2.765 | 2.570 | 2.659 | 2.700 | 2.874 | 2.894 | 2.524 | 2.306 | 2.226 |
| 2024 | 2.244 | 2.326 | 2.480 | |||||||||
| - = No Data Reported; -- = Not Applicable; NA = Not Available; W = Withheld to avoid disclosure of individual company data. |
| Release Date: 4/17/2024 |
| Next Release Date: 4/24/2024 |
Referring Pages: