|
Download Data (XLS File) |
|
||||||||||||
|
||||||||||||
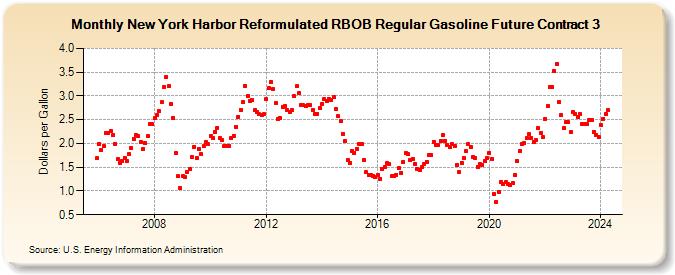
| New York Harbor Reformulated RBOB Regular Gasoline Future Contract 3 (Dollars per Gallon) | ||||||||||||
| Year | Jan | Feb | Mar | Apr | May | Jun | Jul | Aug | Sep | Oct | Nov | Dec |
|---|---|---|---|---|---|---|---|---|---|---|---|---|
| 2005 | 1.686 | |||||||||||
| 2006 | 1.989 | 1.852 | 1.941 | 2.216 | 2.217 | 2.252 | 2.179 | 1.992 | 1.664 | 1.586 | 1.631 | 1.694 |
| 2007 | 1.628 | 1.768 | 1.913 | 2.096 | 2.182 | 2.146 | 2.031 | 1.888 | 2.007 | 2.148 | 2.400 | 2.403 |
| 2008 | 2.535 | 2.602 | 2.675 | 2.864 | 3.186 | 3.403 | 3.206 | 2.839 | 2.533 | 1.799 | 1.308 | 1.056 |
| 2009 | 1.306 | 1.287 | 1.405 | 1.466 | 1.709 | 1.933 | 1.686 | 1.884 | 1.771 | 1.937 | 2.028 | 1.981 |
| 2010 | 2.157 | 2.122 | 2.249 | 2.331 | 2.107 | 2.071 | 1.955 | 1.940 | 1.949 | 2.106 | 2.166 | 2.352 |
| 2011 | 2.566 | 2.713 | 2.865 | 3.209 | 2.996 | 2.889 | 2.913 | 2.694 | 2.661 | 2.613 | 2.588 | 2.614 |
| 2012 | 2.928 | 3.157 | 3.294 | 3.140 | 2.842 | 2.505 | 2.526 | 2.775 | 2.784 | 2.696 | 2.666 | 2.699 |
| 2013 | 2.989 | 3.199 | 3.062 | 2.817 | 2.802 | 2.779 | 2.807 | 2.799 | 2.703 | 2.617 | 2.626 | 2.744 |
| 2014 | 2.836 | 2.930 | 2.898 | 2.938 | 2.906 | 2.968 | 2.727 | 2.567 | 2.469 | 2.204 | 2.047 | 1.655 |
| 2015 | 1.597 | 1.839 | 1.807 | 1.887 | 1.995 | 1.988 | 1.652 | 1.390 | 1.342 | 1.341 | 1.323 | 1.291 |
| 2016 | 1.334 | 1.260 | 1.459 | 1.504 | 1.581 | 1.560 | 1.309 | 1.325 | 1.342 | 1.477 | 1.388 | 1.612 |
| 2017 | 1.797 | 1.776 | 1.651 | 1.680 | 1.573 | 1.464 | 1.442 | 1.497 | 1.574 | 1.611 | 1.760 | 1.751 |
| 2018 | 2.038 | 1.962 | 1.964 | 2.050 | 2.169 | 2.058 | 1.957 | 1.916 | 1.984 | 1.949 | 1.549 | 1.391 |
| 2019 | 1.594 | 1.703 | 1.834 | 1.980 | 1.916 | 1.718 | 1.690 | 1.507 | 1.560 | 1.551 | 1.638 | 1.685 |
| 2020 | 1.807 | 1.668 | 0.941 | 0.768 | 0.983 | 1.191 | 1.149 | 1.180 | 1.140 | 1.133 | 1.164 | 1.342 |
| 2021 | 1.632 | 1.836 | 1.991 | 2.001 | 2.108 | 2.188 | 2.115 | 2.026 | 2.068 | 2.329 | 2.224 | 2.128 |
| 2022 | 2.516 | 2.788 | 3.183 | 3.178 | 3.517 | 3.674 | 2.872 | 2.598 | 2.326 | 2.441 | 2.444 | 2.250 |
| 2023 | 2.652 | 2.615 | 2.561 | 2.621 | 2.403 | 2.407 | 2.408 | 2.490 | 2.493 | 2.241 | 2.181 | 2.130 |
| 2024 | 2.393 | 2.523 | 2.615 | |||||||||
| - = No Data Reported; -- = Not Applicable; NA = Not Available; W = Withheld to avoid disclosure of individual company data. |
| Release Date: 4/24/2024 |
| Next Release Date: 5/1/2024 |
Referring Pages: