|
Download Data (XLS File) |
|
||||||||||||
|
||||||||||||
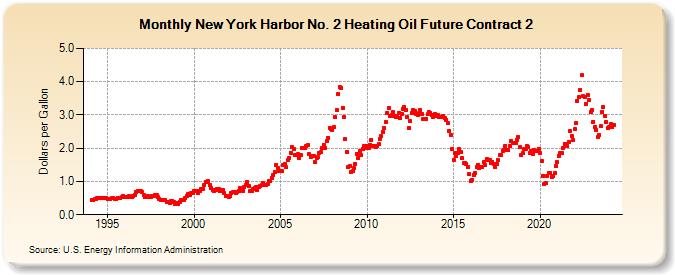
| New York Harbor No. 2 Heating Oil Future Contract 2 (Dollars per Gallon) | ||||||||||||
| Year | Jan | Feb | Mar | Apr | May | Jun | Jul | Aug | Sep | Oct | Nov | Dec |
|---|---|---|---|---|---|---|---|---|---|---|---|---|
| 1994 | 0.454 | 0.431 | 0.463 | 0.482 | 0.496 | 0.507 | 0.503 | 0.496 | 0.496 | 0.504 | 0.491 | |
| 1995 | 0.483 | 0.479 | 0.466 | 0.499 | 0.505 | 0.484 | 0.475 | 0.501 | 0.511 | 0.495 | 0.522 | 0.566 |
| 1996 | 0.534 | 0.518 | 0.534 | 0.551 | 0.528 | 0.521 | 0.561 | 0.605 | 0.675 | 0.719 | 0.698 | 0.710 |
| 1997 | 0.680 | 0.581 | 0.546 | 0.535 | 0.559 | 0.529 | 0.540 | 0.556 | 0.553 | 0.594 | 0.579 | 0.522 |
| 1998 | 0.475 | 0.454 | 0.428 | 0.440 | 0.428 | 0.397 | 0.385 | 0.363 | 0.416 | 0.406 | 0.377 | 0.336 |
| 1999 | 0.341 | 0.317 | 0.388 | 0.435 | 0.428 | 0.445 | 0.515 | 0.563 | 0.611 | 0.595 | 0.650 | 0.667 |
| 2000 | 0.704 | 0.724 | 0.702 | 0.651 | 0.724 | 0.779 | 0.785 | 0.883 | 0.987 | 0.971 | 0.999 | 0.895 |
| 2001 | 0.805 | 0.756 | 0.705 | 0.744 | 0.776 | 0.764 | 0.709 | 0.745 | 0.730 | 0.643 | 0.568 | 0.548 |
| 2002 | 0.541 | 0.548 | 0.640 | 0.673 | 0.674 | 0.658 | 0.692 | 0.724 | 0.794 | 0.784 | 0.721 | 0.822 |
| 2003 | 0.880 | 0.981 | 0.850 | 0.712 | 0.724 | 0.766 | 0.794 | 0.833 | 0.757 | 0.834 | 0.850 | 0.905 |
| 2004 | 0.964 | 0.887 | 0.903 | 0.915 | 1.014 | 1.007 | 1.110 | 1.195 | 1.271 | 1.495 | 1.411 | 1.305 |
| 2005 | 1.316 | 1.316 | 1.509 | 1.517 | 1.421 | 1.633 | 1.697 | 1.867 | 2.032 | 1.972 | 1.789 | 1.781 |
| 2006 | 1.817 | 1.716 | 1.788 | 1.991 | 2.010 | 2.012 | 2.069 | 2.089 | 1.811 | 1.738 | 1.751 | 1.765 |
| 2007 | 1.571 | 1.693 | 1.741 | 1.867 | 1.887 | 1.999 | 2.098 | 2.017 | 2.213 | 2.317 | 2.610 | 2.575 |
| 2008 | 2.551 | 2.628 | 2.930 | 3.154 | 3.630 | 3.837 | 3.813 | 3.218 | 2.952 | 2.269 | 1.875 | 1.448 |
| 2009 | 1.464 | 1.275 | 1.305 | 1.397 | 1.531 | 1.827 | 1.698 | 1.912 | 1.792 | 1.984 | 2.058 | 2.020 |
| 2010 | 2.071 | 1.996 | 2.106 | 2.252 | 2.066 | 2.067 | 2.034 | 2.077 | 2.132 | 2.279 | 2.354 | 2.499 |
| 2011 | 2.613 | 2.783 | 3.058 | 3.220 | 2.976 | 2.992 | 3.090 | 2.960 | 2.942 | 2.957 | 3.067 | 2.910 |
| 2012 | 3.039 | 3.180 | 3.237 | 3.161 | 2.923 | 2.617 | 2.814 | 3.062 | 3.144 | 3.122 | 3.021 | 2.992 |
| 2013 | 3.045 | 3.139 | 3.022 | 2.880 | 2.881 | 2.890 | 3.019 | 3.077 | 3.052 | 2.990 | 2.942 | 3.036 |
| 2014 | 2.958 | 3.003 | 2.935 | 2.949 | 2.927 | 2.966 | 2.898 | 2.858 | 2.751 | 2.528 | 2.390 | 1.977 |
| 2015 | 1.646 | 1.858 | 1.764 | 1.845 | 1.966 | 1.896 | 1.695 | 1.542 | 1.560 | 1.525 | 1.447 | 1.209 |
| 2016 | 1.018 | 1.056 | 1.205 | 1.259 | 1.428 | 1.509 | 1.410 | 1.434 | 1.447 | 1.582 | 1.484 | 1.680 |
| 2017 | 1.658 | 1.651 | 1.543 | 1.596 | 1.520 | 1.433 | 1.532 | 1.632 | 1.782 | 1.801 | 1.921 | 1.949 |
| 2018 | 2.068 | 1.936 | 1.938 | 2.066 | 2.210 | 2.148 | 2.144 | 2.158 | 2.254 | 2.336 | 2.038 | 1.785 |
| 2019 | 1.845 | 1.961 | 1.990 | 2.063 | 2.033 | 1.857 | 1.928 | 1.836 | 1.931 | 1.915 | 1.920 | 1.987 |
| 2020 | 1.855 | 1.620 | 1.176 | 0.914 | 0.953 | 1.164 | 1.248 | 1.259 | 1.141 | 1.158 | 1.250 | 1.452 |
| 2021 | 1.579 | 1.776 | 1.855 | 1.864 | 2.020 | 2.123 | 2.130 | 2.073 | 2.198 | 2.506 | 2.379 | 2.243 |
| 2022 | 2.564 | 2.767 | 3.428 | 3.528 | 3.748 | 4.189 | 3.569 | 3.551 | 3.337 | 3.608 | 3.434 | 3.083 |
| 2023 | 3.138 | 2.796 | 2.650 | 2.549 | 2.339 | 2.394 | 2.659 | 3.086 | 3.237 | 2.974 | 2.786 | 2.593 |
| 2024 | 2.644 | 2.717 | 2.642 | |||||||||
| - = No Data Reported; -- = Not Applicable; NA = Not Available; W = Withheld to avoid disclosure of individual company data. |
| Release Date: 4/10/2024 |
| Next Release Date: 4/17/2024 |
Referring Pages: