|
Download Data (XLS File) |
|
||||||||||||
|
||||||||||||
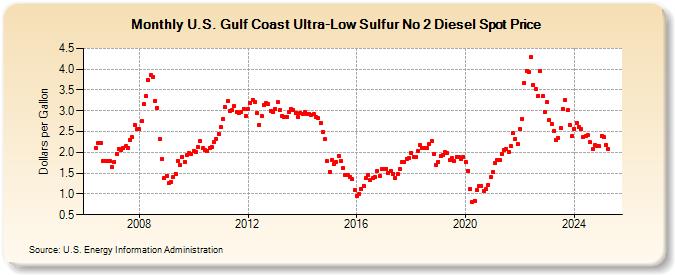
| U.S. Gulf Coast Ultra-Low Sulfur No 2 Diesel Spot Price (Dollars per Gallon) | ||||||||||||
| Year | Jan | Feb | Mar | Apr | May | Jun | Jul | Aug | Sep | Oct | Nov | Dec |
|---|---|---|---|---|---|---|---|---|---|---|---|---|
| 2006 | 2.108 | 2.231 | 2.233 | 1.789 | 1.784 | 1.797 | 1.791 | |||||
| 2007 | 1.639 | 1.777 | 1.970 | 2.092 | 2.045 | 2.093 | 2.144 | 2.116 | 2.294 | 2.361 | 2.657 | 2.561 |
| 2008 | 2.551 | 2.749 | 3.153 | 3.347 | 3.733 | 3.851 | 3.816 | 3.241 | 3.076 | 2.312 | 1.843 | 1.372 |
| 2009 | 1.426 | 1.258 | 1.292 | 1.396 | 1.489 | 1.802 | 1.695 | 1.900 | 1.773 | 1.941 | 1.980 | 1.959 |
| 2010 | 2.035 | 1.998 | 2.125 | 2.267 | 2.093 | 2.066 | 2.042 | 2.093 | 2.130 | 2.252 | 2.324 | 2.446 |
| 2011 | 2.601 | 2.793 | 3.081 | 3.231 | 3.001 | 3.015 | 3.117 | 2.974 | 2.937 | 2.960 | 3.046 | 2.878 |
| 2012 | 3.034 | 3.178 | 3.270 | 3.217 | 2.947 | 2.667 | 2.879 | 3.143 | 3.186 | 3.157 | 2.997 | 2.960 |
| 2013 | 3.044 | 3.200 | 3.007 | 2.879 | 2.843 | 2.861 | 2.981 | 3.040 | 3.014 | 2.935 | 2.857 | 2.953 |
| 2014 | 2.913 | 2.973 | 2.917 | 2.932 | 2.904 | 2.921 | 2.842 | 2.821 | 2.709 | 2.500 | 2.314 | 1.784 |
| 2015 | 1.531 | 1.824 | 1.711 | 1.776 | 1.917 | 1.802 | 1.624 | 1.463 | 1.444 | 1.418 | 1.351 | 1.089 |
| 2016 | 0.958 | 0.999 | 1.127 | 1.199 | 1.378 | 1.460 | 1.343 | 1.379 | 1.400 | 1.544 | 1.427 | 1.596 |
| 2017 | 1.593 | 1.608 | 1.502 | 1.558 | 1.482 | 1.386 | 1.486 | 1.601 | 1.777 | 1.756 | 1.851 | 1.867 |
| 2018 | 1.996 | 1.895 | 1.895 | 2.029 | 2.181 | 2.102 | 2.098 | 2.114 | 2.210 | 2.282 | 1.962 | 1.687 |
| 2019 | 1.774 | 1.908 | 1.939 | 2.012 | 1.983 | 1.807 | 1.873 | 1.788 | 1.895 | 1.876 | 1.838 | 1.899 |
| 2020 | 1.770 | 1.552 | 1.124 | 0.804 | 0.838 | 1.083 | 1.190 | 1.196 | 1.082 | 1.107 | 1.211 | 1.403 |
| 2021 | 1.523 | 1.744 | 1.824 | 1.813 | 1.971 | 2.068 | 2.071 | 2.015 | 2.152 | 2.455 | 2.324 | 2.195 |
| 2022 | 2.550 | 2.810 | 3.676 | 3.953 | 3.934 | 4.286 | 3.629 | 3.535 | 3.357 | 3.963 | 3.344 | 2.975 |
| 2023 | 3.207 | 2.771 | 2.690 | 2.518 | 2.302 | 2.351 | 2.597 | 3.050 | 3.265 | 3.009 | 2.662 | 2.385 |
| 2024 | 2.569 | 2.707 | 2.598 | 2.562 | 2.372 | 2.385 | ||||||
| - = No Data Reported; -- = Not Applicable; NA = Not Available; W = Withheld to avoid disclosure of individual company data. |
| Release Date: 7/24/2024 |
| Next Release Date: 7/31/2024 |
Referring Pages: