|
Download Data (XLS File) |
|
||||||||
|
||||||||
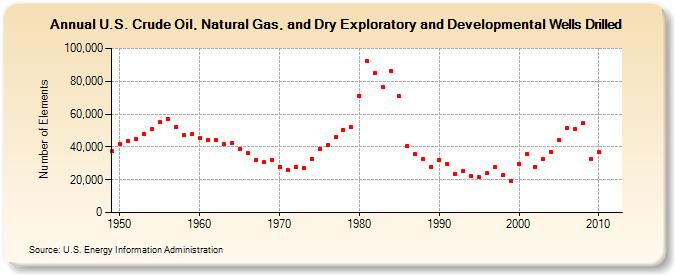
| U.S. Crude Oil, Natural Gas, and Dry Exploratory and Developmental Wells Drilled (Number of Elements) | ||||||||
| Decade | Year-0 | Year-1 | Year-2 | Year-3 | Year-4 | Year-5 | Year-6 | Year-7 | Year-8 | Year-9 |
|---|---|---|---|---|---|---|---|---|---|---|
| 1940's | 37,312 | |||||||||
| 1950's | 42,050 | 43,643 | 44,563 | 47,740 | 51,109 | 55,150 | 57,170 | 51,995 | 46,941 | 47,563 |
| 1960's | 45,619 | 44,254 | 44,158 | 41,467 | 42,293 | 38,773 | 36,384 | 32,234 | 30,599 | 32,187 |
| 1970's | 28,010 | 26,133 | 27,709 | 27,420 | 32,901 | 38,721 | 40,855 | 45,852 | 50,145 | 52,204 |
| 1980's | 71,205 | 92,090 | 84,914 | 76,405 | 86,128 | 70,796 | 40,611 | 35,473 | 32,343 | 27,988 |
| 1990's | 32,067 | 29,528 | 23,608 | 25,451 | 22,255 | 21,600 | 23,886 | 27,586 | 22,911 | 18,939 |
| 2000's | 29,287 | 35,558 | 27,871 | 32,833 | 37,057 | 44,022 | 51,429 | 51,071 | 54,302 | 32,803 |
| 2010's | 36,611 | NA | NA |
| - = No Data Reported; -- = Not Applicable; NA = Not Available; W = Withheld to avoid disclosure of individual company data. |
| Release Date: 3/29/2024 |
| Next Release Date: 4/30/2024 |
Referring Pages: