|
Download Data (XLS File) |
|
||||||||
|
||||||||
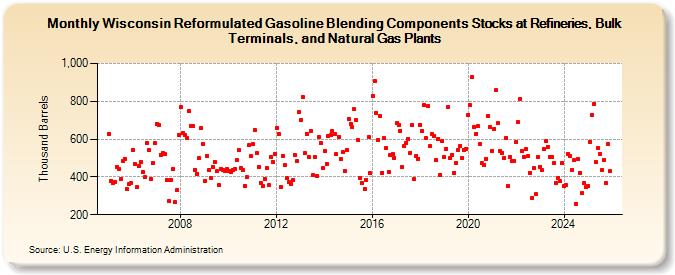
| Wisconsin Reformulated Gasoline Blending Components Stocks at Refineries, Bulk Terminals, and Natural Gas Plants (Thousand Barrels) | ||||||||
| Year | Jan | Feb | Mar | Apr | May | Jun | Jul | Aug | Sep | Oct | Nov | Dec |
|---|---|---|---|---|---|---|---|---|---|---|---|---|
| 2005 | 627 | 380 | 369 | 373 | 455 | 442 | 390 | 484 | 497 | 337 | 362 | 366 |
| 2006 | 541 | 468 | 345 | 459 | 480 | 426 | 397 | 582 | 542 | 387 | 475 | 577 |
| 2007 | 682 | 672 | 518 | 524 | 519 | 385 | 272 | 386 | 443 | 268 | 329 | 623 |
| 2008 | 769 | 631 | 620 | 605 | 748 | 671 | 670 | 439 | 417 | 498 | 657 | 572 |
| 2009 | 379 | 513 | 435 | 396 | 453 | 479 | 429 | 355 | 444 | 439 | 430 | 440 |
| 2010 | 432 | 428 | 438 | 443 | 489 | 541 | 449 | 437 | 354 | 398 | 567 | 509 |
| 2011 | 572 | 648 | 526 | 455 | 370 | 354 | 390 | 448 | 355 | 505 | 481 | 522 |
| 2012 | 658 | 628 | 348 | 513 | 461 | 392 | 372 | 363 | 382 | 518 | 483 | 741 |
| 2013 | 699 | 823 | 526 | 629 | 506 | 644 | 410 | 506 | 405 | 610 | 577 | 447 |
| 2014 | 535 | 468 | 614 | 620 | 641 | 625 | 520 | 612 | 495 | 530 | 430 | 541 |
| 2015 | 708 | 682 | 662 | 757 | 701 | 595 | 392 | 367 | 337 | 386 | 612 | 420 |
| 2016 | 829 | 908 | 739 | 596 | 720 | 423 | 604 | 553 | 428 | 515 | 522 | 501 |
| 2017 | 684 | 674 | 645 | 453 | 562 | 582 | 603 | 529 | 674 | 390 | 513 | 496 |
| 2018 | 676 | 643 | 782 | 604 | 775 | 563 | 628 | 618 | 487 | 602 | 412 | 590 |
| 2019 | 503 | 550 | 770 | 500 | 518 | 423 | 473 | 544 | 566 | 501 | 541 | 549 |
| 2020 | 730 | 779 | 929 | 663 | 629 | 668 | 575 | 472 | 465 | 497 | 721 | 665 |
| 2021 | 535 | 655 | 859 | 683 | 537 | 529 | 502 | 607 | 351 | 505 | 485 | 483 |
| 2022 | 584 | 690 | 814 | 537 | 506 | 545 | 508 | 423 | 288 | 447 | 308 | 504 |
| 2023 | 454 | 435 | 547 | 589 | 560 | 506 | 503 | 476 | 370 | 392 | 376 | 474 |
| 2024 | 353 | |||||||||||
| - = No Data Reported; -- = Not Applicable; NA = Not Available; W = Withheld to avoid disclosure of individual company data. |
| Release Date: 3/29/2024 |
| Next Release Date: 4/30/2024 |