|
Download Data (XLS File) |
|
||||||||
|
||||||||
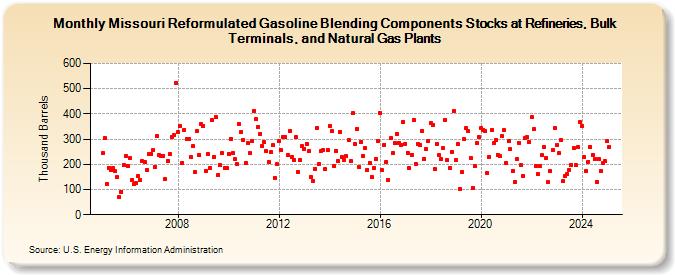
| Missouri Reformulated Gasoline Blending Components Stocks at Refineries, Bulk Terminals, and Natural Gas Plants (Thousand Barrels) | ||||||||
| Year | Jan | Feb | Mar | Apr | May | Jun | Jul | Aug | Sep | Oct | Nov | Dec |
|---|---|---|---|---|---|---|---|---|---|---|---|---|
| 2005 | 243 | 305 | 122 | 187 | 178 | 184 | 172 | 148 | 71 | 92 | 197 | 231 |
| 2006 | 195 | 224 | 138 | 120 | 125 | 153 | 137 | 212 | 209 | 179 | 239 | 241 |
| 2007 | 256 | 189 | 311 | 236 | 231 | 234 | 141 | 215 | 240 | 310 | 315 | 523 |
| 2008 | 327 | 351 | 207 | 337 | 301 | 301 | 227 | 271 | 168 | 333 | 238 | 358 |
| 2009 | 352 | 175 | 239 | 184 | 375 | 228 | 387 | 157 | 196 | 243 | 186 | 187 |
| 2010 | 241 | 302 | 245 | 220 | 201 | 359 | 327 | 296 | 206 | 286 | 243 | 293 |
| 2011 | 412 | 378 | 348 | 321 | 273 | 288 | 251 | 210 | 247 | 275 | 146 | 200 |
| 2012 | 293 | 255 | 309 | 309 | 235 | 331 | 227 | 217 | 308 | 171 | 216 | 271 |
| 2013 | 262 | 282 | 251 | 150 | 135 | 183 | 345 | 201 | 251 | 256 | 180 | 257 |
| 2014 | 353 | 332 | 193 | 254 | 214 | 329 | 227 | 218 | 231 | 295 | 212 | 402 |
| 2015 | 281 | 342 | 189 | 289 | 234 | 264 | 179 | 207 | 150 | 185 | 221 | 294 |
| 2016 | 404 | 176 | 278 | 211 | 139 | 303 | 244 | 284 | 320 | 286 | 278 | 368 |
| 2017 | 282 | 246 | 185 | 238 | 376 | 203 | 282 | 278 | 334 | 223 | 260 | 294 |
| 2018 | 362 | 354 | 180 | 281 | 235 | 220 | 263 | 376 | 216 | 186 | 249 | 412 |
| 2019 | 216 | 279 | 102 | 169 | 299 | 343 | 332 | 225 | 107 | 192 | 283 | 308 |
| 2020 | 343 | 337 | 332 | 165 | 230 | 338 | 283 | 295 | 238 | 231 | 312 | 335 |
| 2021 | 206 | 292 | 259 | 173 | 131 | 220 | 286 | 198 | 155 | 305 | 307 | 289 |
| 2022 | 386 | 339 | 194 | 161 | 194 | 235 | 269 | 226 | 128 | 173 | 257 | 344 |
| 2023 | 275 | 243 | 297 | 132 | 153 | 161 | 179 | 198 | 263 | 196 | 268 | 366 |
| 2024 | 352 | |||||||||||
| - = No Data Reported; -- = Not Applicable; NA = Not Available; W = Withheld to avoid disclosure of individual company data. |
| Release Date: 3/29/2024 |
| Next Release Date: 4/30/2024 |